

Key Points
MSCs have reduced stem cell functionality in SCD and decreased HSC maintenance ability in vitro and in vivo.
Hemolysis activates Toll-like receptor-4 signaling in MSCs, which can be reversed by transfusions.

Abstract
Sickle cell disease (SCD) is characterized by hemolytic anemia, which can trigger oxidative stress, inflammation, and tissue injury that contribute to disease complications. Bone marrow mesenchymal stromal cells (MSCs) tightly regulate hematopoietic stem cell (HSC) homeostasis in health and disease, but their functionality in SCD remains unclear. We identified for the first time that murine SCD MSCs have altered gene signatures, reduced stem cell properties, and increased oxidative stress, due in part to hemolysis. Murine SCD MSCs had lower HSC maintenance ability in vitro and in vivo, as manifested by increased HSC mobilization and decreased HSC engraftment after transplant. Activation of Toll-like receptor-4 through p65 in MSCs further contributed to MSC dysfunction. Transfusions led to an improved MSC and HSC oxidative state in SCD mice. Improving the regulation between MSCs and HSCs has vital implications for enhancing clinical HSC transplantation and gene therapy outcomes and for identification of new molecular targets for alleviating SCD complications.
Introduction
Sickle cell disease (SCD) is an inherited blood disorder due to a mutation in the β-globin chain of hemoglobin (Hb) causing its polymerization when deoxygenated, resulting in vaso-occlusion, hemolytic anemia, and organ injury along with early mortality.1 Red blood cell (RBC) transfusions are commonly used for treatment and prevention of SCD complications, with as many as 90% of patients needing at least 1 transfusion in their lifetime.2,3 Transfusions, by ameliorating anemia, suppress endogenous erythropoiesis4,5 and thus reduce RBC hemolysis.6 Indeed, there is increasing evidence that free Hb and heme play central roles in SCD pathophysiology.7,8 Free Hb and free heme cause pro-oxidant and cytotoxic damage through extravascular translocation, free radical generation, and oxidative stress to lipids, proteins, and nucleic acids, which is further exacerbated by depletion of Hb and heme scavengers due to the chronic hemolytic state in SCD.9-14 Free heme in SCD activates endothelial cells via Toll-like receptor-4 (TLR-4),15,16 which contributes to microvasculature occlusion resulting in tissue infarction. Although bone marrow vascular structure alterations and vaso-occlusion within the bone marrow leading to increased hypoxia and angiogenesis17 have been reported in SCD, less well studied is the impact of chronic hemolysis and persistent oxidative stress on the SCD bone marrow hematopoietic microenvironment.18,19 Hematopoietic stem cell (HSC) transplantation with myeloablative regimens in patients using related haploidentical donors20 or gene-edited autologous sources21 in SCD serves as a curative treatment but is limited in availability of HLA-matched donors.22 Increased mortality in patients who underwent transplant was observed with increased patient age. Given that successful gene therapy21,23 or HSC transplantation of healthy donor cells relies on functional bone marrow stroma for the engraftment of transplanted HSCs,24 the impediments to positive transplant outcomes in a subset of patients with SCD may partly be due to a disrupted bone marrow stroma in SCD. A recent pause in SCD clinical gene therapy trials due to the development of myeloid neoplasms in 3 research participants raises urgency for better characterization of the bone marrow microenvironment in SCD.25
Mesenchymal stromal cells (MSCs), a major component of the bone marrow stroma, serve as key players of the HSC niche by maintaining HSC homeostasis in steady state and, upon activation, promoting HSC egress to the circulation.26-28 Many MSC populations are perivascular, lining the outer surface of blood vessels.26 MSC stem cell properties are defined by their ability to self-renew, form colonies in vitro, and differentiate into bone, cartilage, and fat lineages.29 Human SCD bone marrow MSCs were previously found to have altered expression of SCF and CXCL12, key HSC niche factors, but maintain some functionality in vitro compared with those from healthy donors, such as proliferation rate, surface protein expression, and immunomodulatory ability.30 However, many MSC functional assays and properties were not evaluated such as self-renewal, differentiation capacity, and assessment of oxidative damage. Furthermore, the potential contribution of the bone marrow stroma and MSCs to the maintenance of HSC numbers and functionality in SCD has not been assessed.
In the current study, we tested our hypothesis that MSCs in the SCD bone marrow microenvironment are altered in part due to the oxidative stress induced by free heme. Focusing on MSC functional properties, including their ability to maintain HSCs, we characterized MSCs in a SCD mouse model and assessed the impact of hemolysis and hemolytic pathways on wild-type mouse MSC functionality. Finally, we tested whether RBC transfusions, known to correct hemolytic markers, were able to improve MSC functionality in our SCD model. Enhanced understanding of the bone marrow niche in SCD and other hemolytic conditions could provide a basis for designing more effective therapeutic approaches in hemolytic disease, including optimization of transplantation protocols.
Methods
Mice
The Townes transgenic mouse model of SCD was used in this study.31 These mice present extensive organ damage, including enlarged spleens, liver necrosis, and vascular occlusion in the kidneys.31,32 SA sickle trait mice were chosen as controls for all of our experiments because they are the closest genetically related control to SS mice but do not harbor any disease-related abnormalities. Adult SCD mice and controls used ranged between 8 and 12 weeks of age and comprised both male and female mice. Experimental and control mice were age and sex matched for individual experiments. C57/BL6, B6.SJL-Ptprca Pepcb/BoyJ (CD45.1), B6;129-Hbbtm2(HBG1,HBB*)Tow/Hbbtm3(HBG1,HBB)Tow Hbatm1(HBA)Tow/J (Townes), B6(Cg)-Tlr4tm1.2Karp/J (TLR4 knockout [KO]), B6.129(Cg)-Leprtm2(cre)Rck/J (Lepr-cre), and B6(Cg)-Tlr4tm1.1Karp/J (TLR4f/f) mice were purchased from The Jackson Laboratory and bred in-house. All mice were housed in a pathogen-free facility at 22°C using a light:dark cycle of 12:12 hours. All murine experiments were approved by the Animal Use and Care Committee of New York Blood Center.
Gene expression analysis
For gene expression analysis, sorted cells were lysed and subjected to messenger RNA isolation with the Dynabeads mRNA Direct Kit (Thermo Fisher Scientific). Subsequently, reverse transcription to produce complementary DNA was achieved by using the RNA to cDNA EcoDry Premix (Takara). Quantitative polymerase chain reaction (PCR) was performed by using SYBR Green (Roche). Analysis was done on the ViiA 7 Real-Time PCR System (Applied Biosystems). Relative gene expression was determined based on the comparative Ct method and normalized to the reference gene glyceraldehyde-3-phosphate dehydrogenase (Gapdh).
Statistical analysis
For normal data distributions, we used an unpaired, 2-tailed Student t test and assumed both populations have the same standard deviation. An α level of 0.05 was used to determine statistical significance. For multiple sample comparison, an analysis of variance was conducted by using the Tukey post hoc test for multiple comparison correction or repeated measure correction. All murine data are representative of ≥ 3 repeated experiments.
Additional materials and methods are provided in the supplemental Methods (available on the Blood Web site).
Results
Characterization of SCD MSCs
We interrogated differences in the murine SCD bone marrow environment, focusing on the MSCs and their stem cell properties, including colony formation, self-renewal, and trilineage differentiation. SCD bone marrow cellularity was reduced (Figure 1A) similar to previous findings,33,34 with a decreased frequency of Ter119–CD45–CD31–CD51+PDGFRα+35 MSCs (Figure 1B) in the bone marrow. Further analysis of the bone marrow MSCs revealed increased reactive oxygen species (ROS) accumulation (Figure 1C) along with an increased presence of apoptotic cells (supplemental Figure 1A). Next, we evaluated MSCs from SS mice for their clonogenic capacity in vitro. Interestingly, we observed no differences between SS MSCs and SA control MSCs in their colony-forming unit-fibroblast potential (supplemental Figure 1B-D). To directly examine self-renewal functions, MSC ability to form mesenspheres was assessed. Although we did not detect any differences in primary mesensphere formation (supplemental Figure 1E), SS MSCs had a significantly reduced ability to form secondary mesenspheres, suggestive of decreased self-renewal (supplemental Figure 1F). Although SS MSCs were able to differentiate into bone, cartilage, and fat lineages (Figure 1D), we observed a decrease in adipogenic and osteogenic differentiation potential, suggestive of impaired MSC functional properties. Differentiated cells from SS MSCs compared with control SA MSCs had a similar area of lipid droplet formation (supplemental Figure 1G) but contained significantly fewer numbers of lipid droplets (supplemental Figure 1H). This corresponded with decreased expression of the late adipogenic gene Fabp4 (Figure 1E) but similar expression levels of the early adipogenic gene Pparγ between SS and control MSCs, which is a similar phenotype to MSCs from patients with β-thalassemia.36 A decrease in osteogenic differentiation potential (Figure 1D), along with a decrease in expression of the osteogenic genes Sp7 and Col1a2, was observed with SS MSCs, also resembling MSCs from patients with β-thalassemia36,37 and consistent with increased risk for developing orthopedic complications in SCD.38
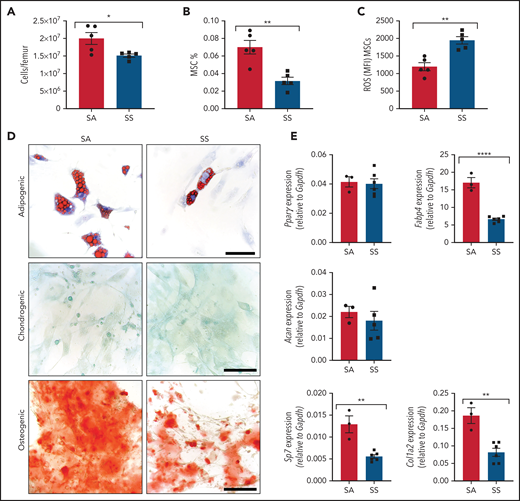
Characterization of MSC phenotype in SCD. (A-B) SCD mice were analyzed by using flow cytometry for total bone marrow cellularity (A) and Ter119–CD45–CD31–CD51+PDGFRα+ MSC frequency of total bone marrow cells (B). (C) ROS mean fluorescence intensity (MFI) in MSCs was determined by DCFDA. N = 5 mice for panels A-C. Sorted MSCs from Townes SS mice in culture were differentiated into adipogenic, chondrogenic, and osteogenic lineages. (D) Representative images of Oil-red-O staining to mark lipid droplets among adipogenic differentiated cells, Alcian blue for chondrogenic differentiation, and Alizarin red for osteogenic differentiation. Scale bar, 100 µM. Images are representative from N = 6 mice. (E) Corresponding adipogenic (Fabp4, Pparγ), chondrogenic (Acan), and osteogenic (Sp7, Col1a2) specific gene expression determined by RT-PCR (N = 3-6 mice). Gene expression is relative to Gapdh. Data were analyzed with a 2-tailed, unpaired Student t test. Data are presented as mean ± standard error of the mean. *P ≤ .05, **P ≤ .01, ****P ≤ .0001.
Characterization of MSC phenotype in SCD. (A-B) SCD mice were analyzed by using flow cytometry for total bone marrow cellularity (A) and Ter119–CD45–CD31–CD51+PDGFRα+ MSC frequency of total bone marrow cells (B). (C) ROS mean fluorescence intensity (MFI) in MSCs was determined by DCFDA. N = 5 mice for panels A-C. Sorted MSCs from Townes SS mice in culture were differentiated into adipogenic, chondrogenic, and osteogenic lineages. (D) Representative images of Oil-red-O staining to mark lipid droplets among adipogenic differentiated cells, Alcian blue for chondrogenic differentiation, and Alizarin red for osteogenic differentiation. Scale bar, 100 µM. Images are representative from N = 6 mice. (E) Corresponding adipogenic (Fabp4, Pparγ), chondrogenic (Acan), and osteogenic (Sp7, Col1a2) specific gene expression determined by RT-PCR (N = 3-6 mice). Gene expression is relative to Gapdh. Data were analyzed with a 2-tailed, unpaired Student t test. Data are presented as mean ± standard error of the mean. *P ≤ .05, **P ≤ .01, ****P ≤ .0001.
We next analyzed the transcriptomes of bone marrow MSCs from SCD (SS) mice and control mice (SA) by RNA sequencing and found significant differences among the gene expression patterns in SCD MSCs compared with MSCs from controls (Figure 2A-C; supplemental Table 1). Bone marrow MSCs have been shown to express numerous key genes, which play a role in maintaining HSCs within the bone marrow in steady state.28,39-43 Focusing on HSC maintenance genes, we found Angpt1, an important gene for promoting HSC maintenance,43 among the top 50 downregulated genes in SS MSCs. A decrease was observed in gene expression according to reverse transcription PCR (RT-PCR) of key niche factors (Figure 2D), including Opn, Vcam1, Angpt1, Scf, and Cxcl12, suggestive of altered HSC maintenance ability. In the bone marrow extracellular fluid, we also detected reduced levels of CXCL12 (supplemental Figure 2). Thus, we observed damaged MSCs with a reduction in their ability to maintain their stem cell state, along with the presence of oxidative stress in SCD MSCs, further highlighting the differences in phenotype between SCD MSCs and control MSCs.
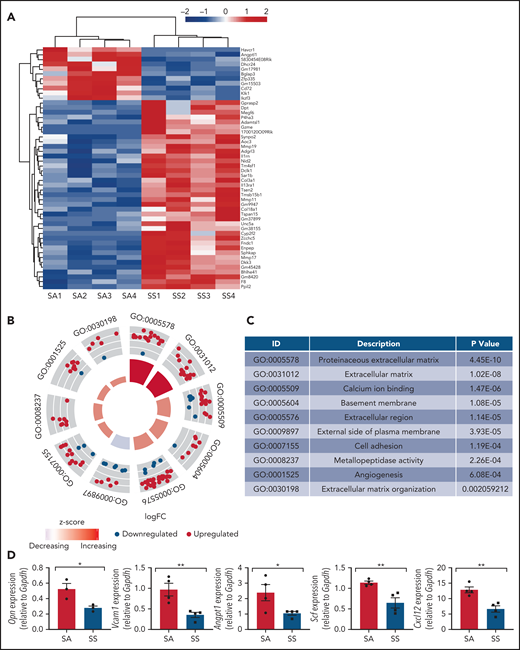
Gene signatures of sickle MSCs. RNA-sequencing transcriptome analysis and RT-PCR were conducted on sorted MSCs from Townes SS mice vs SA control mice. (A) The top 50 differentially expressed genes from RNA sequencing are presented and arranged by using hierarchical clustering. Experimental and control groups were age and sex matched. Each lane represents sorted MSCs from different mice. (B) Top 10 differentially expressed Gene Ontology categories among SS MSCs compared with SA MSCs. (C) Table listing the top 10 differentially expressed Gene Ontology categories and corresponding P values among SS MSCs compared with SA MSCs. (D) RT-PCR analysis revealed that HSC maintenance genes were downregulated among SS MSCs compared with SA MSCs. Gene expression levels were normalized to Gapdh. Data are presented as mean ± standard error of the mean. Statistical significance was determined by using a 2-tailed, unpaired Student t test (D). N = 4 for all experiments. *P ≤ .05, **P ≤ .01.
Gene signatures of sickle MSCs. RNA-sequencing transcriptome analysis and RT-PCR were conducted on sorted MSCs from Townes SS mice vs SA control mice. (A) The top 50 differentially expressed genes from RNA sequencing are presented and arranged by using hierarchical clustering. Experimental and control groups were age and sex matched. Each lane represents sorted MSCs from different mice. (B) Top 10 differentially expressed Gene Ontology categories among SS MSCs compared with SA MSCs. (C) Table listing the top 10 differentially expressed Gene Ontology categories and corresponding P values among SS MSCs compared with SA MSCs. (D) RT-PCR analysis revealed that HSC maintenance genes were downregulated among SS MSCs compared with SA MSCs. Gene expression levels were normalized to Gapdh. Data are presented as mean ± standard error of the mean. Statistical significance was determined by using a 2-tailed, unpaired Student t test (D). N = 4 for all experiments. *P ≤ .05, **P ≤ .01.
SCD alterations of HSCs
We next tested whether altered HSC maintenance genes in SCD MSCs lead to increased HSC mobilization into the bloodstream. Consistent with downregulated HSC maintenance gene expression among SCD MSCs, hematopoietic stem and progenitor cells (Lin–Sca1+c-Kit+Flt3–)44 were increased in the circulation (Figure 3A), whereas a slight decrease in HSC (Lin–Sca1+c-Kit+CD48–CD150+) frequency was detected in the bone marrow (Figure 3B) of SS mice compared with SA controls. We also evaluated the extent of HSC oxidative stress and DNA damage in SS HSCs. With ImageStream analysis, we observed that SCD HSCs had increased DNA damage marked by the accumulation of γH2AX foci (Figure 3C-D) along with an increased presence of ROS as measured by DCFDA (Figure 3E-G).
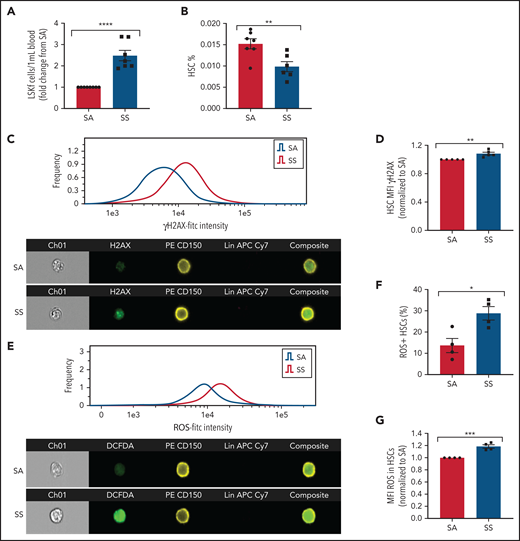
Hematopoietic stem and progenitor cells in SCD. (A) Townes SS mice were analyzed for the peripheral blood hematopoietic stem and progenitor cell population marked by Lin–Sca1+c-Kit+Flt3– represented as fold change in number per mL blood among SS mice relative to SA mice (N = 7-8 mice). (B) Bone marrow HSC frequency was assessed by flow cytometry for Lin–Sca1+c-Kit+CD48–CD150+ (N = 6-7 mice). (C) Representative histogram and images of bone marrow hematopoietic cells from SA and SS mice gated on live cells and stained by Lineage-CD150+γH2AX+ by ImageStream analysis. (D) Quantification by ImageStream of the mean fluorescence intensity (MFI) of γH2AX in sickle mouse HSCs normalized to control HSCs (N = 5 mice). (E) Representative histogram and images of bone marrow hematopoietic cells from SA and SS mice gated on live cells and stained by Lineage-CD150+ and DCFDA by ImageStream analysis. (F) Quantification of the frequency of HSCs containing ROS in sickle and control bone marrow by ImageStream (N = 4 mice). (G) Quantification of the mean fluorescence intensity (MFI) of ROS in sickle and control bone marrow HSCs by ImageStream (N = 4 mice) presented as fold change of SS compared with SA. Data were analyzed with a 2-tailed, unpaired Student t test. Data are presented as mean ± standard error of the mean. *P ≤ .05, **P ≤ .01, ***P ≤ .001, ****P ≤ .0001.
Hematopoietic stem and progenitor cells in SCD. (A) Townes SS mice were analyzed for the peripheral blood hematopoietic stem and progenitor cell population marked by Lin–Sca1+c-Kit+Flt3– represented as fold change in number per mL blood among SS mice relative to SA mice (N = 7-8 mice). (B) Bone marrow HSC frequency was assessed by flow cytometry for Lin–Sca1+c-Kit+CD48–CD150+ (N = 6-7 mice). (C) Representative histogram and images of bone marrow hematopoietic cells from SA and SS mice gated on live cells and stained by Lineage-CD150+γH2AX+ by ImageStream analysis. (D) Quantification by ImageStream of the mean fluorescence intensity (MFI) of γH2AX in sickle mouse HSCs normalized to control HSCs (N = 5 mice). (E) Representative histogram and images of bone marrow hematopoietic cells from SA and SS mice gated on live cells and stained by Lineage-CD150+ and DCFDA by ImageStream analysis. (F) Quantification of the frequency of HSCs containing ROS in sickle and control bone marrow by ImageStream (N = 4 mice). (G) Quantification of the mean fluorescence intensity (MFI) of ROS in sickle and control bone marrow HSCs by ImageStream (N = 4 mice) presented as fold change of SS compared with SA. Data were analyzed with a 2-tailed, unpaired Student t test. Data are presented as mean ± standard error of the mean. *P ≤ .05, **P ≤ .01, ***P ≤ .001, ****P ≤ .0001.
SCD MSCs have reduced ability to maintain HSCs
Next, we investigated whether MSCs contributed to the increased oxidative stress and DNA damage in SS HSCs. To test this theory, we compared murine SCD MSCs vs control MSCs in their ability to maintain healthy murine HSCs in vitro. Interestingly, after 6 days of coculture between lineage-negative hematopoietic cells and SS MSCs, there was a reduction in Lin–Sca1+c-Kit+ (LSK) progenitor population number compared with coculture with SA MSCs (Figure 4A) along with a decrease in HSC number (Figure 4B). SS MSCs pretreated with the antioxidant N-acetyl-l-cysteine (NAC) in vitro for 8 hours followed by coculture with lineage-negative hematopoietic stem and progenitor cells led to a significant increase in LSKs (Figure 4C) and HSCs (Figure 4D). Expression of key HSC maintenance genes Scf and Opn (Figure 4E-F) was increased according to RT-PCR, confirming that oxidative stress in sickle MSCs is inhibiting their ability to maintain HSCs in vitro, although Cxcl12 levels in MSCs remained unaltered after NAC treatment (Figure 4G), possibly due to MSC ineffectiveness in maintaining select niche factors in culture.45 Interestingly, these results were confirmed in vivo with SCD mice treated with NAC for 2 weeks. After NAC treatment, an increase in SCD bone marrow HSCs (supplemental Figure 3A) was observed along with a decrease in peripheral blood hematopoietic stem and progenitor cells (supplemental Figure 3B). Furthermore, an increased frequency of MSCs was detected in SCD mice treated with NAC (supplemental Figure 3C), along with a decrease in ROS accumulation among MSCs (supplemental Figure 3D), cumulatively confirming the role of oxidative stress in disrupting MSC regulation of HSCs within the bone marrow microenvironment.
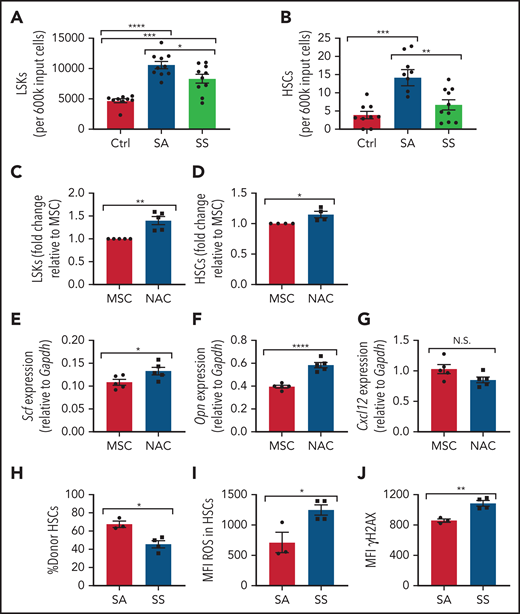
Maintenance of hematopoietic cells by SCD MSCs. (A-B) Lineage-negative hematopoietic cells from B6 mice were cultured alone (control) or together with MSCs from SS or SA mice. After 6 days of coculture, we determined the number of Lin–Sca1+c-Kit+ population (N = 9-10 cocultures from 5 mice) (A) and number of Lin–Sca1+c-Kit+CD48-CD150+ HSC population (N = 9-10 cocultures from 5 mice) (B) present within the culture system by flow cytometry. MSCs were treated with NAC or vehicle (control) for 8 hours followed by coculture with lineage-negative hematopoietic cells for 3 days. (C) The fold change difference in Lin–Sca1+c-Kit+ population after NAC treatment (N = 5 cocultures from 5 mice) is presented relative to that of the MSC-only group. (D) The fold-change difference in Lin–Sca1+c-Kit+CD48–CD150+ HSC population after NAC treatment (N= cocultures from 5 mice) is presented relative to that of the MSC-only group. HSC maintenance gene expression among MSCs was assessed by RT-PCR after 8 hours of NAC treatment of Scf (E), Opn (F), and Cxcl12 (G) (N = 5 cocultures from 5 mice). HSCs cocultured with SS or SA MSCs were transplanted into CD45.1 mice and analyzed after 16 weeks. (H) Bone marrow HSC donor engraftment frequency (N = 3-4 mice). (I) Mean fluorescence intensity (MFI) of ROS content in engrafted HSCs (N = 3-4 mice). (J) MFI of γH2AX in HSCs (N = 3-4 mice). Data are presented as mean ± standard error of the mean. Data were analyzed by using 1-way analysis of variance with Tukey multiple comparison test (A-B), or a 2-tailed, unpaired Student t test (C-J). *P ≤ .05, **P ≤ .01, ***P ≤ .001, ****P ≤ .0001. N.S., not significant.
Maintenance of hematopoietic cells by SCD MSCs. (A-B) Lineage-negative hematopoietic cells from B6 mice were cultured alone (control) or together with MSCs from SS or SA mice. After 6 days of coculture, we determined the number of Lin–Sca1+c-Kit+ population (N = 9-10 cocultures from 5 mice) (A) and number of Lin–Sca1+c-Kit+CD48-CD150+ HSC population (N = 9-10 cocultures from 5 mice) (B) present within the culture system by flow cytometry. MSCs were treated with NAC or vehicle (control) for 8 hours followed by coculture with lineage-negative hematopoietic cells for 3 days. (C) The fold change difference in Lin–Sca1+c-Kit+ population after NAC treatment (N = 5 cocultures from 5 mice) is presented relative to that of the MSC-only group. (D) The fold-change difference in Lin–Sca1+c-Kit+CD48–CD150+ HSC population after NAC treatment (N= cocultures from 5 mice) is presented relative to that of the MSC-only group. HSC maintenance gene expression among MSCs was assessed by RT-PCR after 8 hours of NAC treatment of Scf (E), Opn (F), and Cxcl12 (G) (N = 5 cocultures from 5 mice). HSCs cocultured with SS or SA MSCs were transplanted into CD45.1 mice and analyzed after 16 weeks. (H) Bone marrow HSC donor engraftment frequency (N = 3-4 mice). (I) Mean fluorescence intensity (MFI) of ROS content in engrafted HSCs (N = 3-4 mice). (J) MFI of γH2AX in HSCs (N = 3-4 mice). Data are presented as mean ± standard error of the mean. Data were analyzed by using 1-way analysis of variance with Tukey multiple comparison test (A-B), or a 2-tailed, unpaired Student t test (C-J). *P ≤ .05, **P ≤ .01, ***P ≤ .001, ****P ≤ .0001. N.S., not significant.
We next examined the ability of SS MSCs to maintain HSC functional properties with respect to HSC engraftment, HSC ROS levels, and DNA damage. To test this, CD45.2 HSCs cocultured with SCD MSCs or SA MSCs were transplanted into CD45.1 mice. A decrease in bone marrow donor HSC engraftment was detected in the SS MSC coculture group compared with the SA MSC group (Figure 4H). Interestingly, at 16 weeks’ posttransplant, these bone marrow HSCs displayed increased ROS (Figure 4I) and γH2AX (Figure 4J), suggesting that SCD MSCs can contribute to oxidative damage in SCD HSCs.
MSCs respond to free heme in the SCD bone marrow microenvironment
To isolate the role of intravascular free heme in promoting SCD complications, we modeled the effect of chronic heme exposure by injecting wild-type mice with 50 µmol/kg hemin 3 times per week for 4 weeks.46 Mice became anemic (supplemental Figure 4A-B) and displayed increased reticulocyte counts (supplemental Figure 4C) with long-term hemin injection. A significant increase in hematopoietic stem and progenitor cells was noted in the peripheral blood (Figure 5A). Interestingly, there was a downregulation in Cxcl12 (Figure 5B), Scf (Figure 5C), Vcam1 (supplemental Figure 5A), Angpt1 (supplemental Figure 5B), and Opn (supplemental Figure 5C) HSC regulatory gene expression by RT-PCR among hemin-treated MSCs. MSC ROS levels (Figure 5D) and HSC ROS levels (Figure 5E) were significantly upregulated, similar to that in native SCD mice (Figures 1C and 3G). Therefore, intravascular exposure to hemin leads to functional alterations in the bone marrow microenvironment with increased HSC egress into peripheral blood, similar to that observed in the SCD mouse model. This finding suggests that free heme can contribute to oxidative stress in SCD MSCs and affect their HSC maintenance ability.
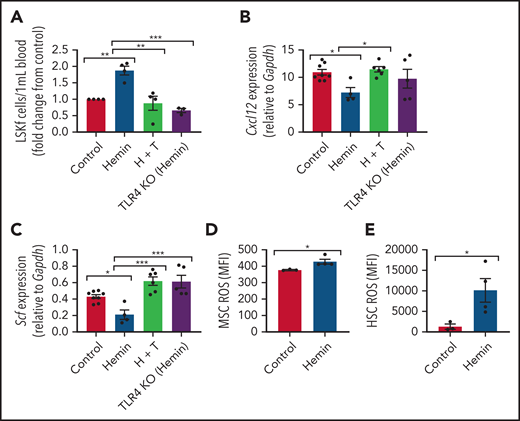
Alterations to the bone marrow microenvironment due to free heme exposure. C57BL/6 mice were injected with 50 µmol/kg hemin 3 times per week or phosphate-buffered saline (control) for 30 days to mimic long-term heme exposure. To examine if TLR4 inhibition can block heme-mediated effects in stromal cells, B6 mice were treated with hemin plus TAK-242 (H + T). An additional group of TLR4 KO mice were treated with hemin for comparison. (A) Peripheral blood hematopoietic stem and progenitor cells marked by Lineage-Ckit+Sca1+Flt3– expression as measured by flow cytometry represented as fold change in number per mL blood relative to control (N = 3-4). Gene expression of Cxcl12 (B) and Scf (C) among bone marrow MSCs in each group as measured by RT-PCR and normalized to Gapdh (N = 4-8). (D) Mean fluorescence intensity (MFI) of DCFDA among CD45–Ter119–CD31–PDGFRα+CD51+ MSCs in the bone marrow (N = 3-4 mice). (E) MFI of DCFDA among Lin–Sca1+c-Kit+CD48–CD150+ HSCs in the bone marrow (N = 3-4 mice). Data are presented as mean ± standard error of the mean. Data were analyzed with 1-way analysis of variance with Tukey multiple comparison test (A-C), or a 2-tailed, unpaired Student t test (D-E). *P ≤ .05, **P ≤ .01, ***P ≤ .001.
Alterations to the bone marrow microenvironment due to free heme exposure. C57BL/6 mice were injected with 50 µmol/kg hemin 3 times per week or phosphate-buffered saline (control) for 30 days to mimic long-term heme exposure. To examine if TLR4 inhibition can block heme-mediated effects in stromal cells, B6 mice were treated with hemin plus TAK-242 (H + T). An additional group of TLR4 KO mice were treated with hemin for comparison. (A) Peripheral blood hematopoietic stem and progenitor cells marked by Lineage-Ckit+Sca1+Flt3– expression as measured by flow cytometry represented as fold change in number per mL blood relative to control (N = 3-4). Gene expression of Cxcl12 (B) and Scf (C) among bone marrow MSCs in each group as measured by RT-PCR and normalized to Gapdh (N = 4-8). (D) Mean fluorescence intensity (MFI) of DCFDA among CD45–Ter119–CD31–PDGFRα+CD51+ MSCs in the bone marrow (N = 3-4 mice). (E) MFI of DCFDA among Lin–Sca1+c-Kit+CD48–CD150+ HSCs in the bone marrow (N = 3-4 mice). Data are presented as mean ± standard error of the mean. Data were analyzed with 1-way analysis of variance with Tukey multiple comparison test (A-C), or a 2-tailed, unpaired Student t test (D-E). *P ≤ .05, **P ≤ .01, ***P ≤ .001.
TLR4 activity among MSCs contributes in part to MSC dysfunction
It has been shown previously in endothelial cells that heme can bind to and activate TLR4-mediated signaling.15 To investigate the role of TLR4 in heme-mediated effects on MSCs, wild-type mice (C57BL/6) were treated with 50 µmol/kg hemin followed by the TLR4 inhibitor TAK-242 3 times per week for 4 weeks. TLR4 KO mice treated with 50 µmol/kg hemin were compared as well. Interestingly, both hemin-treated TLR4 KO mice and mice cotreated with TAK-242 and hemin had decreased peripheral blood hematopoietic stem and progenitor cells compared with hemin-treated wild-type mice (Figure 5A). Accordingly, a significant increase in Cxcl12 and Scf gene expression by RT-PCR was present among bone marrow MSCs in TAK-242 and hemin cotreated mice compared with hemin-treated wild-type mice (Figure 5B-C). An increase in Scf by RT-CPR was also observed in TLR4 KO mice treated with hemin compared with hemin-treated wild-type mice (Figure 5C). Hemin-treated mice led to increased gene expression of Rela (p65) in MSCs, which was blocked by TAK-242, and in TLR4 KO mice (supplemental Figure 5D), whereas Mapk14 (P38) expression did not change in MSCs after heme or TAK-242 treatment or in TLR4 KO mice (supplemental Figure 5E). To further examine the role of TLR4 in MSCs, Lepr-cre mice were crossed with TLR4fl/fl mice to specifically deplete TLR4 among Lepr+ cells. Lepr-cre;TLR4fl/fl mice were treated with hemin 3 times per week for 4 weeks. Downregulation of HSC regulatory gene expression, as well as increased expression of P65, was prevented in MSCs from Lepr-cre; TLR4fl/fl mice after hemin treatment (supplemental Figure 6A-B), consistent with the data after TAK-242 treatment. Concomitantly, increased mobilization of hematopoietic stem and progenitor cells into the peripheral blood, along with increased levels of γH2AX in HSCs due to hemin treatment, was prevented in Lepr-cre;TLR4fl/fl mice (supplemental Figure 6C-D). Collectively, these results suggest that TLR4 inhibition can block hemin-mediated effects in MSCs.
Next, we investigated the role of TLR4 in contributing to the MSC phenotype among SCD mice. Numerous genes within the TLR4 pathway were significantly changed in SCD MSCs compared with control SA MSCs, including an upregulation in TLR4 expression (Figure 6A). To functionally assess the role of this pathway in contributing to MSC-associated changes in the bone marrow, we injected SCD mice for 5 days with TAK-24247,48 to inhibit the TLR4 pathway. Interestingly, expression of p38 did not change (Figure 6B) in the MSCs of the TAK-242–injected mice compared with the control mice, whereas p65 was significantly downregulated (Figure 6C). This finding suggests that the TLR4-driven MSC dysfunction is upregulated in SCD mice through NF-κB as opposed to AP-1.49 Accordingly, there was a decrease in ROS accumulation among SCD MSCs (Figure 6D) along with a decrease in ROS among HSCs after TAK-242 treatment (Figure 6E). Peripheral blood hematopoietic stem and progenitor cell number were decreased in SCD mice after TAK-242 treatment (Figure 6F). Concordant with this, bone marrow MSCs displayed increased gene expression of Cxcl12 (supplemental Figure 7A) and Scf (supplemental Figure 7B) by RT-PCR. A slight increase in bone marrow HSC frequency was also observed (supplemental Figure 7C) along with a significant increase in MSC frequency (supplemental Figure 7D). Importantly, SA mice treated with TAK-242 did not display changes in ROS levels among HSCs or MSCs, nor did their MSC P65 expression change (supplemental Figure 7E-G), showing the specificity of TAK-242 treatment to SCD mice. Altogether, these results suggest that TLR4 signaling, potentially mediated by heme, contributes to MSC dysfunction in SCD mice.
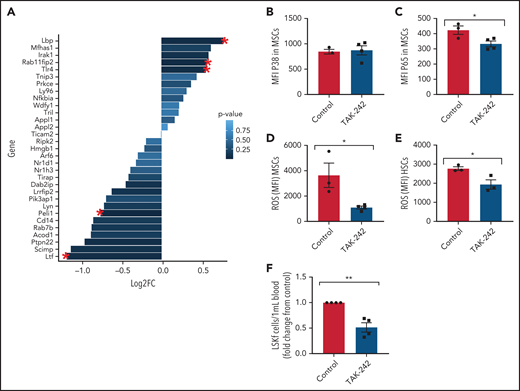
In vivo inhibition of TLR4 in SCD mice. (A) Clustering of genes related to TLR4 Gene Ontology pathway in SS vs SA MSCs from RNA-sequencing analysis. Red star indicates significant fold change (FC) (P ≤ .05); N = 4 mice per group. To investigate the effect of TLR4 inhibition in SCD mice, SS mice were injected with 1 mg/kg TAK-242 for 5 days to systemically inhibit TLR4 activity and compared with vehicle-injected SS mice (control). (B-E) Using flow cytometry, the mean fluorescence intensity (MFI) of p38 expression among bone marrow MSCs (B) and MFI of p65 expression among bone marrow MSCs (C) was determined. Furthermore, using flow cytometry, the MFI of DCFDA among MSCs in the bone marrow (D) and MFI of DCFDA among HSCs in the bone marrow (E) were assessed. (F) Peripheral blood hematopoietic stem and progenitor cell population marked by Lineage-Sca1+Ckit+Flt3– is represented as FC in number per mL relative to control. N = 3-4 mice for panels B-F. Data were analyzed with a 2-tailed, unpaired Student t test (B-F). Data are presented as mean ± standard error of the mean. *P ≤ .05, **P ≤ .01.
In vivo inhibition of TLR4 in SCD mice. (A) Clustering of genes related to TLR4 Gene Ontology pathway in SS vs SA MSCs from RNA-sequencing analysis. Red star indicates significant fold change (FC) (P ≤ .05); N = 4 mice per group. To investigate the effect of TLR4 inhibition in SCD mice, SS mice were injected with 1 mg/kg TAK-242 for 5 days to systemically inhibit TLR4 activity and compared with vehicle-injected SS mice (control). (B-E) Using flow cytometry, the mean fluorescence intensity (MFI) of p38 expression among bone marrow MSCs (B) and MFI of p65 expression among bone marrow MSCs (C) was determined. Furthermore, using flow cytometry, the MFI of DCFDA among MSCs in the bone marrow (D) and MFI of DCFDA among HSCs in the bone marrow (E) were assessed. (F) Peripheral blood hematopoietic stem and progenitor cell population marked by Lineage-Sca1+Ckit+Flt3– is represented as FC in number per mL relative to control. N = 3-4 mice for panels B-F. Data were analyzed with a 2-tailed, unpaired Student t test (B-F). Data are presented as mean ± standard error of the mean. *P ≤ .05, **P ≤ .01.
Transfusion alleviates SCD MSC dysfunction
Transfusions remain a mainstay of treatment for the management of SCD complications. How transfusions affect MSCs in the bone marrow hematopoietic microenvironment is not well known. To investigate the effect of transfusions on reversing the dysfunctional ability of SCD bone marrow MSCs to maintain HSCs, we transfused SCD mice with the equivalent of 2 units of packed RBCs to mimic an acute transfusion setting. Analysis at 3 days after transfusion revealed improvements in markers of anemia, including an increase in Hb levels (supplemental Figure 8A) and decreased reticulocyte percentages (supplemental Figure 8B), as well as an increase in plasma heme scavenger hemopexin concentration (supplemental Figure 8C), suggestive of decreased free heme. Although no difference in MSC frequency was detected after short-term transfusion (data not shown), a decrease in ROS accumulation (Figure 7A) was detected among MSCs from transfused mice compared with control mice transfused with phosphate-buffered saline. Concurrently, we also observed a decrease in peripheral blood hematopoietic stem and progenitor cell frequency (Figure 7B), an increase in bone marrow HSC frequency (Figure 7C), and an increase in gene expression of Cxcl12 (Figure 7D) and Scf (Figure 7E) according to RT-PCR among bone marrow MSCs in transfused mice compared with control mice. After long-term transfusion for 1 month, similar trends were present in the bone marrow microenvironment (supplemental Figure 8D-F), suggesting that transfusions may decrease the oxidative stress state in the bone marrow.
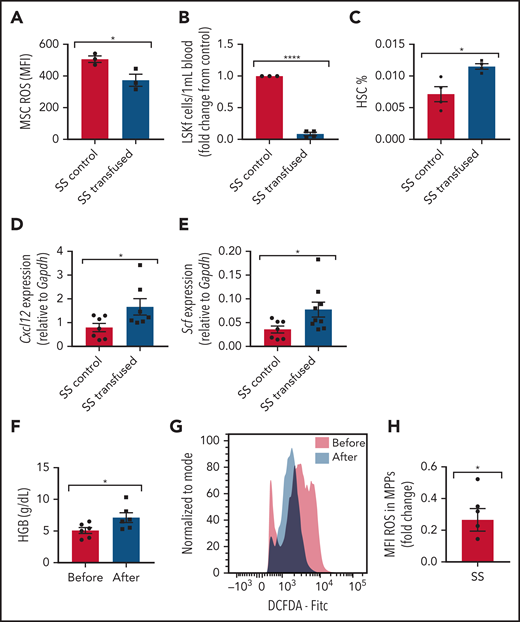
Transfusion effect on hematopoietic microenvironment. Townes SS mice were transfused with 2 leuko-reduced RBC units to represent short-term transfusions and analyzed 3 days later. (A) Mean fluorescence intensity (MFI) of DCFDA signal measuring ROS among MSCs in transfused mice and SS control phosphate-buffered saline transfused mice (N = 3 mice). (B) Peripheral blood hematopoietic stem and progenitor cell population marked by Lineage-Sca1+Ckit+Flt3– is represented as fold change in number per mL of the transfused group relative to control (N = 3-4 mice). (C) Bone marrow HSC frequency determined by flow cytometry (N = 3-4 mice). Gene expression for Cxcl12 (D) and Scf (E) among sorted MSCs in transfused and control groups as determined by using RT-PCR (N = 7-9 mice). Peripheral blood samples from patients with SCD on a chronic RBC exchange transfusion regimen were analyzed immediately before their transfusion and 4 hours after their transfusion . (F) Hemoglobin (HGB) levels in transfused patients before and after transfusion measured by ADVIA automated cell counter (N = 6). (G) Representative histogram of DCFDA levels in human SCD multipotent progenitor cells (Lin–CD34+CD38–CD45RA–CD90–CD49f–). (H) Fold change of DCFDA levels in human SCD multipotent progenitor cells compared before and after transfusion (N = 6 patients). Data are presented as mean ± standard error of the mean. Data were analyzed with a 2-tailed, unpaired Student t test. (A-F), or a 1-sample Student t test. *P ≤ .05, ****P ≤ .0001.
Transfusion effect on hematopoietic microenvironment. Townes SS mice were transfused with 2 leuko-reduced RBC units to represent short-term transfusions and analyzed 3 days later. (A) Mean fluorescence intensity (MFI) of DCFDA signal measuring ROS among MSCs in transfused mice and SS control phosphate-buffered saline transfused mice (N = 3 mice). (B) Peripheral blood hematopoietic stem and progenitor cell population marked by Lineage-Sca1+Ckit+Flt3– is represented as fold change in number per mL of the transfused group relative to control (N = 3-4 mice). (C) Bone marrow HSC frequency determined by flow cytometry (N = 3-4 mice). Gene expression for Cxcl12 (D) and Scf (E) among sorted MSCs in transfused and control groups as determined by using RT-PCR (N = 7-9 mice). Peripheral blood samples from patients with SCD on a chronic RBC exchange transfusion regimen were analyzed immediately before their transfusion and 4 hours after their transfusion . (F) Hemoglobin (HGB) levels in transfused patients before and after transfusion measured by ADVIA automated cell counter (N = 6). (G) Representative histogram of DCFDA levels in human SCD multipotent progenitor cells (Lin–CD34+CD38–CD45RA–CD90–CD49f–). (H) Fold change of DCFDA levels in human SCD multipotent progenitor cells compared before and after transfusion (N = 6 patients). Data are presented as mean ± standard error of the mean. Data were analyzed with a 2-tailed, unpaired Student t test. (A-F), or a 1-sample Student t test. *P ≤ .05, ****P ≤ .0001.
We next examined whether human hematopoietic stem and progenitor cells can also modulate oxidative stress after transfusion. In human SCD peripheral blood samples drawn immediately before monthly RBC exchange transfusion compared with 4 hours’ posttransfusion, there was an increase in Hb (Figure 7F) suggestive of an improvement in anemia, similar to previous reports.50 Due to the small patient sample volume obtained, we next analyzed ROS among the multipotent progenitor (MPP) population as opposed to the more restrictive HSC subset. As expected, we did not observe any difference in MPP frequency before and after transfusion (data not shown), but remarkably, after transfusion, there was a significant decrease in ROS accumulation among the MPP cell (Lin–CD34+CD38–CD45RA–CD90–CD49f–) population (Figure 7G-H), consistent with our murine results. Longer time interval posttransfusion may reveal more pronounced changes.
Discussion
MSCs in the bone marrow have been shown to tightly regulate hematopoietic stem and progenitor cell quiescence during homeostasis.28 The role of MSCs in contributing to HSC maintenance in SCD has not been well studied. Using a murine model of SCD, we discovered that bone marrow MSCs have a significant functional defect at the molecular and cellular level, including altered gene expression profile, TLR4/p65 activation, ROS accumulation, and decreased self-renewal. Free heme contributes to a state of high oxidative stress in SCD.10-12 We found that injections of hemin in control mice replicated many functional MSC defects observed in SCD, implicating heme as a significant driver in the SCD microenvironment altering the MSC phenotype of SCD mice. Based on these findings, our working model is that hemolysis through TLR4/p65 activation induces oxidative damage to MSCs, altering their ability to maintain HSCs in SCD.
We show for the first time a role for altered bone marrow niche cells in contributing to the oxidative stress in SCD HSCs. This was supported by our coculture studies in which healthy HSCs cultured with SCD MSCs exhibited oxidative stress in vivo as well as decreased engraftment compared with those cocultured with control MSCs. It remains to be seen whether the impaired HSC is also detected long term or in secondary transplants. Whether NAC antioxidant treatment during hematopoietic transplantation can improve MSC properties leading to improved engraftment remains to be seen, but we did find improved SCD MSC ability to maintain HSCs in vitro after pretreatment of MSCs with NAC. In addition, direct treatment of SCD mice with NAC yielded a similar effect on MSCs. Our in vivo studies using the TLR4-signaling inhibitor TAK-242, which led to reductions in MSC ROS levels and improved HSC maintenance, also support the strategy of targeting MSC oxidative stress for improving transplant efficacy. Although further studies are needed to dissect the underlying cause of altered SCD MSC gene profiles, our studies of hemin injection in wild-type mice supports a role for free heme as a driver of the dysfunctional MSC phenotype. Although there are multiple niche cells that could also affect HSC functionality in SCD,51 our findings show for the first time the important contribution by SCD MSCs. Transfusions, which are currently used as a conditioning regimen in SCD gene therapy trials by lowering ROS levels, were able to shift MSCs toward a healthier state. These studies underscore the beneficial use of transfusions for improving the bone marrow niche microenvironment17 before transplant in SCD. It is interesting to note that we did not detect any toxicity from transfusional iron overload in our SCD model. Similarly, transfusions in the Townes SCD mouse model did not worsen heme or non-heme iron content. It is well documented that transfusional iron overload is a major cause of toxicity in patients with β-thalassemia, but for reasons that remain incompletely understood, patients with SCD are at relatively lower risk of such iron-related complications.52-54 Nevertheless, transfusions do carry risks, including hemolytic transfusion reactions in SCD,55,56 underscoring the need for developing optimal transfusion management strategies such as establishment of guidelines for prophylactic matching as well as the number and frequency of units necessary for transfusion for improving the bone marrow niche.
It is interesting to note that in aging, alterations to HSC number and quality occur along with decreased bone marrow perfusion and anemia.57-59 Aging leads to expansion of bone marrow MSCs with a decreased ability to maintain HSCs.58,59 Our study revealed that the hematopoietic microenvironment in young SCD mice phenocopied some aging-related alterations, including reduced HSC maintenance, decreased HSC maintenance gene expression among MSCs, and increased ROS in MSCs along with HSC oxidative stress. However, it is interesting to note that aged SCD mice compared with aged SCD control mice continued to display these differences, with some becoming more pronounced with age (supplemental Figure 9). Similar to bone loss experienced in aging,60 we also observed decreased differentiation of SCD MSCs in vitro into the osteogenic lineage. These findings confirm previous studies showing that oxidative stress accumulation leads to decreased osteogenic differentiation by MSCs,61 stimulation of osteoclast bone resorption, and lower bone mineral density in vivo.62 Both increased hemolysis63 and oxidative stress64 have been suggested to contribute to development of sickle bone disease. This raises the possibility that MSCs in SCD may contribute to the characteristic bone loss phenotype among patients with SCD65 and represents a novel therapeutic avenue. Analogous to recent reports in bone marrow MSCs of patients with β-thalassemia,36,37 we also observed a decrease in adipogenic differentiation potential of SS MSCs, further underscoring the altered bone marrow niche in SCD. The similarities in β-thalassemia and SCD MSC phenotypes, including ROS accumulation and tri-lineage differentiation profile,36 are intriguing and raise the question of whether an increase in local heme in β-thalassemia as a result of dysregulated erythropoiesis is responsible for the impaired MSC phenotype, similar to what we have found in SCD.
In conclusion, we have identified impaired MSC functional properties in SCD, in part through hemolysis, that affect HSC functionality both in vitro and in vivo. This finding highlights the importance of MSCs as key therapeutic targets, such as through the TLR4 pathway, for improving the bone marrow hematopoietic niche. By conditioning and enhancing MSCs in the bone marrow microenvironment, this study has implications for optimization of HSC engraftment in bone marrow transplantation, including gene therapy, and potentially for reducing the risk of developing hematologic malignancies after transplant66,67 and gene therapy.25
Acknowledgments
The authors thank Mihaela Barbu-Stevanovic and Zannatul Monia for their guidance with flow cytometry and cell sorting. They also thank Kathy Tang (New York Blood Center) for mouse maintenance. In addition, they appreciate the help of Varshini Vasudevaraja (NYU) for her assistance with RNA-sequencing data analysis and acknowledge Olivia Stamatatos for her assistance with ImageStream analysis. Part of the visual abstract was created by using Servier Medical Art (http://smart.servier.com/), licensed under a Creative Commons Attribution 3.0 Unported License (https://creativecommons.org/licenses/by/3.0/).
The Genome Technology Center at NYU Langone is partially supported by Cancer Center Support Grant P30CA016087 at the Laura and Isaac Perlmutter Cancer Center. This work was also supported, in part, by funds from The National Blood Foundation Early Career Scientific Research Grants Program (A.M.), the Rose M. Badgeley Residuary Charitable Trust (A.M.), and the National Institutes of Health, National Heart, Lung, and Blood Institute (R21HL139695 [A.M.]; P01HL149626 [K.Y.]; and R01HL145451 [K.Y.]).
Authorship
Contribution: A.M. designed all of the experiments with the consultation of P.S., X.A., and K.Y.; experiments were performed by A.M., A.N.S., M.R., H.Z., and A.T., along with data analysis; Y.L. assisted with blood collection; M.R. assisted with differentiation assays and genomic analysis; D.M. was responsible for patient selection and obtaining patient consent; D.S. assisted with flow cytometry studies; W.B. assisted with transplantation studies and other in vivo experiments; X.A. and P.S. provided input on data analysis; K.Y. provided input with data analysis and overall project supervision; A.M. wrote the manuscript; and K.Y. and P.S. edited the manuscript with consultation and contribution from all coauthors.
Conflict-of-interest disclosure: The authors declare no competing financial interests.
Correspondence: Avital Mendelson, New York Blood Center, 310 E 67 St, New York, NY 10065; e-mail: amendelson@nybc.org; Karina Yazdanbakhsh, New York Blood Center, 310 E 67 St, New York, NY 10065; e-mail: kyazdanbakhsh@nybc.org; or Patricia Shi, New York Blood Center, 310 E 67 St, New York, NY 10065; e-mail: pshi@nybc.org.
The RNA-sequencing data have been deposited in the Gene Expression Omnibus database (accession number GSE159373).
All data supporting the findings of this study are available from the corresponding authors upon request by contacting amendelson@nybc.org.
The online version of this article contains a data supplement.
There is a Blood Commentary on this article in this issue.
The publication costs of this article were defrayed in part by page charge payment. Therefore, and solely to indicate this fact, this article is hereby marked “advertisement” in accordance with 18 USC section 1734.

This feature is available to Subscribers Only
Sign In or Create an Account Close Modal