

Key Points
Single-cell transcriptomics reveals selective lineage disruption, abnormal alternative splicing, and polyadenylation in patients with AA.
Identified cell type–specific ligand-receptor interactions, including immunosuppressive therapy sensitive and insensitive interactions.
Abstract
Aplastic anemia (AA) is a T cell–mediated autoimmune disorder of the hematopoietic system manifested by severe depletion of the hematopoietic stem and progenitor cells (HSPCs). Nonetheless, our understanding of the complex relationship between HSPCs and T cells is still obscure, mainly limited by techniques and the sparsity of HSPCs in the context of bone marrow failure. Here we performed single-cell transcriptome analysis of residual HSPCs and T cells to identify the molecular players from patients with AA. We observed that residual HSPCs in AA exhibited lineage-specific alterations in gene expression and transcriptional regulatory networks, indicating a selective disruption of distinct lineage-committed progenitor pools. In particular, HSPCs displayed frequently altered alternative splicing events and skewed patterns of polyadenylation in transcripts related to DNA damage and repair, suggesting a likely role in AA progression to myelodysplastic syndromes. We further identified cell type–specific ligand-receptor interactions as potential mediators for ongoing HSPCs destruction by T cells. By tracking patients after immunosuppressive therapy (IST), we showed that hematopoiesis remission was incomplete accompanied by IST insensitive interactions between HSPCs and T cells as well as sustained abnormal transcription state. These data collectively constitute the transcriptomic landscape of disrupted hematopoiesis in AA at single-cell resolution, providing new insights into the molecular interactions of engaged T cells with residual HSPCs and render novel therapeutic opportunities for AA.

Introduction
As an autoreactive T cell–mediated bone marrow disorder, aplastic anemia (AA) is characterized by depletion of hematopoietic stem and progenitor cells (HSPCs) leading to pancytopenia.1-3 Although the bone marrow is not entirely devoid of HSPCs in patients with AA, the residual progenitor pool is subject to ongoing suppression by infiltrating T cells. Previous efforts have been made to explore the molecular mechanisms underlying hematopoietic repression in AA,4-6 such as dysregulation of genes involved in apoptosis and cell-cycle control.7,8 However, because of the severe paucity of HSPCs remaining in AA bone marrow, the majority of prior studies have resorted to bulk assays of this diverse compartment; hence, it remains unclear how the disease disrupts different lineages of hematopoietic cells in an ecosystem at single-cell resolution.
By proceeding under stress conditions, residual hematopoiesis confers significant risk of malignant progression in AA patients,9 nearly 15% of whom will eventually develop myelodysplastic syndrome (MDS) or acute myeloid leukemia (AML).10-12 Previous targeted genome sequencing studies have identified the full spectrum of mutations that characterize AA,13,14 but very few of these are shared in common with patients with MDS/AML. Instead, both patients with AA and MDS/AML exhibit mutations in splicing-associated genes,14-16 suggesting a potential role for this process in driving disease evolution. Indeed, recent studies have suggested prevalent splicing defects in patients with MDS that may predict clinical outcome,17,18 but it is unknown whether splicing landscape also influences AA progression to MDS/AML.
Previous studies have indicated that AA exerts an autoimmune pathology,19-21 consistent with observations that more than 70% of patients are responsive to immunosuppressive therapy.22 In vitro coculture of patient bone marrow–derived T cells with healthy bone marrow results in significant repression of hematopoiesis.19 Key mediators implicated in this process include interferon-γ (IFN-γ)23,24 and tumor necrosis factor-α (TNF-α),24 which are overproduced by marrow-infiltrating T cells and may interact with receptors including IFN-γ receptor 1/2 and TNF receptor 1/2 that are highly expressed in HSPCs.8,25 These data suggest that cellular interactions between HSPCs and T cells likely play critical roles in suppressing residual hematopoiesis in patients with AA.4,24 However, a comprehensive documentation of the underlying molecular interactions between T cells and HSPCs is lacking.
Here, we interrogated the transcriptomes of both HSPCs and T cells in patients with AA using single-cell RNA-sequencing (scRNA-seq). With this approach, we were able to dissect how AA alters lineage output to confer overall hematopoietic disruption and identify changes in HSPCs splicing profile that might provide a molecular basis for driving AA toward potential MDS outcome. Integrative analysis of gene expression in both HSPCs and T cells further enabled us to define key molecular mediators for the immune attack in AA. Furthermore, we also uncovered the cellular and molecular dynamics supporting hematopoiesis remission by interrogating patients responsive to immunosuppressive therapy.
Methods
Clinical samples
Peripheral blood and bone marrow were obtained from n = 8 healthy donors, n = 19 patients with nonsevere aplastic anemia (non-SAA), and n = 4 patients with severe aplastic anemia (SAA). All samples were recruited via the Blood Diseases Hospital, Chinese Academy of Medical Sciences, except bone marrow–derived HSPCs from 2 healthy donors obtained from our recent study.26 All participants provided written informed consent before inclusion in the study. Biospecimen collection protocols complied with local guidelines and were approved by the ethics committee of the Institute of Hematology and Blood Diseases Hospital, Chinese Academy of Medical Sciences.
scRNA library preparation and sequencing
Both 3′-biased single-cell tagged reverse transcription sequencing (STRT-seq)27-29 and full-length Smart-seq230,31 were applied. For STRT-seq, messenger RNA (mRNA) reverse transcription and complementary DNA (cDNA) amplification were performed according to the published protocol.28 Full-length libraries were constructed following Smart-seq2 method30,31 with minor modifications. We conducted 24 cycles of polymerase chain reaction amplification, after which the cDNA product was purified, and then a further 4 cycles of polymerase chain reaction were performed to obtain sufficient cDNA. Notably, full-length scRNA-seq data were used for alternative splicing and polyadenylation (APA) analysis only.
Data analysis
Low quality reads, primers and adaptor sequences were trimmed. For 3′-biased scRNA-seq data, clean reads were aligned to the human genome (GRCh38) using HISAT2.32 Dimension reduction, cell clustering, and differential gene expression were performed using the Seurat33,34 package. Activity scores of transcription factors were estimated by using SCENIC.35 CellPhoneDB package36,37 was used to estimate cell–cell communication. For full-length data, clean reads were aligned against the human genome using STAR.38 Scmap software39 was used to project cells onto the cell clusters derived from the 3′-biased data. MATS40 and DaPars41 were applied to perform alternative splicing and APA analysis, respectively.
Results
Single-cell transcriptomes of HSPCs in AA
To interrogate the transcriptomes of each HSPC subset in AA and overcome the paucity of HSPC, we performed scRNA-seq (STRT-seq)27-29 of bone marrow–derived HSPCs from n = 15 treatment-naïve patients with AA (supplemental Figure 1A-B; supplemental Table 1, available on the Blood Web site), including n = 12 patients with non-SAA and n = 3 patients with SAA, as well as n = 4 healthy donors. HSPCs (Lin−CD34+) were enriched by fluorescence-activated cell sorting (supplemental Figure 1C-D). Cell phenotypes were recorded via index sorting and used to help retrospectively annotate discrete populations in addition to cell type–specific marker genes (supplemental Figure 2A-B). Of note, by flow cytometry analysis of bone marrow specimens, on average, we observed 0.44% of Lin−CD34+ cells in patients with AA compared with 1.38% in healthy donors (supplemental Figure 1G). After thoroughly sorting 2- to 5-mL bone marrow materials, we could harvest only 15 to 384 HSPCs from each patient. In total, we obtained transcriptomes of 2385 single cells after in silico quality control (supplemental Methods) to reconstruct the hematopoietic hierarchy in patients with AA.
Initial dimension reduction and unsupervised clustering of single-cell transcriptomes classified HSPCs into 9 groups with distinct gene expression patterns, including multipotent and lineage-specific signatures consistent with a previous report42 (Figure 1A; supplemental Figure 2C-D; supplemental Table 2). HSPCs were segregated into a mixed population of hematopoietic stem cells and multipotent progenitors (HSCs/MPPs); lymphoid-primed multipotent progenitors (LMPPs); megakaryocyte and erythroid progenitors (MEPs); multipotent lymphoid progenitors (MLPs); eosinophil, basophil, and mast cell progenitors (EBMs); as well as 2 distinct groups of neutrophil progenitors (Neu1 and Neu2) and 2 subgroups of monocyte/dendritic progenitors (MD1 and MD2). By performing a χ2 test to assess the ratio of observed to expected patient cell subsets, we discovered that the HSPC subset balance was highly variable among patients with AA (Figure 1B; supplemental Figure 3A). although the majority of HSPC subsets were depleted, we also detected a relative increase in EBMs and Neu1 in the AA cohort. Intriguingly, patients with SAA displayed a selective enrichment of HSCs/MPPs and reduced Neu1 population relative to non-SAA (supplemental Figure 3B-C), suggesting a relative abundance of HSCs/MPPs and Neu1 might influence the clinical severity of AA.
![Lineage-specific alterations in residual HSPC by single-cell transcriptomes in patients with AA. (A) Uniform manifold approximation and project (UMAP) visualization of HSPCs based on single-cell transcriptomes (left). Each dot represents a single cell; colors indicate cell clusters with numbered labels (top) and source of donors (bottom) (healthy controls [Ctrls], n = 4; non-SAA, n = 12; SAA, n = 3). Hierarchical clustering showing transcriptional relationships among cell types (right); the dot colors and numbers correspond to their counterparts in the UMAP plot (left). (B) Bar plot showing the ratio of observed to expected numbers of each cell type in patients non-SAA (n = 12). Dots indicate individual patients and dot sizes represent logarithmic transformed P values (χ2 test). Error bars represent ± standard error of the mean. (C) Heat-map showing differentially expressed genes (rows) comparing patients with non-SAA (n = 12) with Ctrl across 9 different cell types (columns). Red indicates upregulation in non-SAA, blue indicates downregulation in non-SAA, and yellow indicates no significant change in expression (Wilcoxon rank-sum test, fold change ≥2, Bonferroni adjusted P ≤ .05). (D) Representative expression of selected gene sets illustrating the heterogeneity of transcriptional modulation and differential expression in HSPCs from patients with non-SAA (n = 12) and SAA (n = 3). *P ≤ .05; **P ≤ 0.01; ***P ≤ 0.001 (Wilcoxon rank-sum test). (E) UMAP visualization of HSPC clustering based on regulons. Each pie chart shows the composition of each regulon cluster by cell types (defined based on single-cell gene expression). (F) Representative display of differential regulon activity in hematopoietic stem cells and multipotent progenitors (top) and megakaryocyte/erythroid progenitors (bottom) corresponding to regulon clusters R1 and R3 in (E), respectively. Dark red dots represent cells from SAA (n = 3), dark blue dots represent cells from patients with non-SAA (n = 12), and dark gray dots represent Ctrl cells (left). Blue indicates active regulons and gray represents inactive regulons (right). (G) Heat-map showing regulons that were differentially activated (rows) between patients with non-SAA (n = 12) and Ctrl across 7 different regulon clusters (columns). Blue to red color indicates low to high regulon activity in non-SAA.](https://ash.silverchair-cdn.com/ash/content_public/journal/blood/138/1/10.1182_blood.2020008966/6/m_bloodbld2020008966f1.png?Expires=1765886280&Signature=Hg2XU8JPm6cTn6W8GBbYhu6t7NuP3ifKRcswM6wUPsk02eR3yTShKIzg3twKT4bpTIC8ZLARckCxDUqF-t5MBB-jD8SCTjhtwGkT5fG2qZKzOUxjNbM~cro~2MY1DHZcJTykhMf4YogXNN2icPBjfIo5ClUCltwWN0rVgbe1QzQIZ513PNfgO2H9J38YjyWO9AFjz8SO0YjgZi-NaL6ApFy6WRUeI4AAzaS2dKE~mccakiE60DjuMh54fyvHG~r1WMX1tMNYhNtsenn~Tn8lZXwTMGGttGz3m-VL53WJjNm6Qg8WPzzkJ62nsLjrK9MmKyvt8ly1k-~bOIBuVTrpyw__&Key-Pair-Id=APKAIE5G5CRDK6RD3PGA)
Lineage-specific alterations in residual HSPC by single-cell transcriptomes in patients with AA. (A) Uniform manifold approximation and project (UMAP) visualization of HSPCs based on single-cell transcriptomes (left). Each dot represents a single cell; colors indicate cell clusters with numbered labels (top) and source of donors (bottom) (healthy controls [Ctrls], n = 4; non-SAA, n = 12; SAA, n = 3). Hierarchical clustering showing transcriptional relationships among cell types (right); the dot colors and numbers correspond to their counterparts in the UMAP plot (left). (B) Bar plot showing the ratio of observed to expected numbers of each cell type in patients non-SAA (n = 12). Dots indicate individual patients and dot sizes represent logarithmic transformed P values (χ2 test). Error bars represent ± standard error of the mean. (C) Heat-map showing differentially expressed genes (rows) comparing patients with non-SAA (n = 12) with Ctrl across 9 different cell types (columns). Red indicates upregulation in non-SAA, blue indicates downregulation in non-SAA, and yellow indicates no significant change in expression (Wilcoxon rank-sum test, fold change ≥2, Bonferroni adjusted P ≤ .05). (D) Representative expression of selected gene sets illustrating the heterogeneity of transcriptional modulation and differential expression in HSPCs from patients with non-SAA (n = 12) and SAA (n = 3). *P ≤ .05; **P ≤ 0.01; ***P ≤ 0.001 (Wilcoxon rank-sum test). (E) UMAP visualization of HSPC clustering based on regulons. Each pie chart shows the composition of each regulon cluster by cell types (defined based on single-cell gene expression). (F) Representative display of differential regulon activity in hematopoietic stem cells and multipotent progenitors (top) and megakaryocyte/erythroid progenitors (bottom) corresponding to regulon clusters R1 and R3 in (E), respectively. Dark red dots represent cells from SAA (n = 3), dark blue dots represent cells from patients with non-SAA (n = 12), and dark gray dots represent Ctrl cells (left). Blue indicates active regulons and gray represents inactive regulons (right). (G) Heat-map showing regulons that were differentially activated (rows) between patients with non-SAA (n = 12) and Ctrl across 7 different regulon clusters (columns). Blue to red color indicates low to high regulon activity in non-SAA.
Lineage-specific alterations in residual HSPC by single-cell transcriptomes in patients with AA. (A) Uniform manifold approximation and project (UMAP) visualization of HSPCs based on single-cell transcriptomes (left). Each dot represents a single cell; colors indicate cell clusters with numbered labels (top) and source of donors (bottom) (healthy controls [Ctrls], n = 4; non-SAA, n = 12; SAA, n = 3). Hierarchical clustering showing transcriptional relationships among cell types (right); the dot colors and numbers correspond to their counterparts in the UMAP plot (left). (B) Bar plot showing the ratio of observed to expected numbers of each cell type in patients non-SAA (n = 12). Dots indicate individual patients and dot sizes represent logarithmic transformed P values (χ2 test). Error bars represent ± standard error of the mean. (C) Heat-map showing differentially expressed genes (rows) comparing patients with non-SAA (n = 12) with Ctrl across 9 different cell types (columns). Red indicates upregulation in non-SAA, blue indicates downregulation in non-SAA, and yellow indicates no significant change in expression (Wilcoxon rank-sum test, fold change ≥2, Bonferroni adjusted P ≤ .05). (D) Representative expression of selected gene sets illustrating the heterogeneity of transcriptional modulation and differential expression in HSPCs from patients with non-SAA (n = 12) and SAA (n = 3). *P ≤ .05; **P ≤ 0.01; ***P ≤ 0.001 (Wilcoxon rank-sum test). (E) UMAP visualization of HSPC clustering based on regulons. Each pie chart shows the composition of each regulon cluster by cell types (defined based on single-cell gene expression). (F) Representative display of differential regulon activity in hematopoietic stem cells and multipotent progenitors (top) and megakaryocyte/erythroid progenitors (bottom) corresponding to regulon clusters R1 and R3 in (E), respectively. Dark red dots represent cells from SAA (n = 3), dark blue dots represent cells from patients with non-SAA (n = 12), and dark gray dots represent Ctrl cells (left). Blue indicates active regulons and gray represents inactive regulons (right). (G) Heat-map showing regulons that were differentially activated (rows) between patients with non-SAA (n = 12) and Ctrl across 7 different regulon clusters (columns). Blue to red color indicates low to high regulon activity in non-SAA.
Hematopoietic lineage-specific transcription defects
We assessed transcriptome alterations in each HSPC subset, yielding a total of 197 and 123 differentially expressed genes (DEGs) in non-SAA and SAA, respectively (Figure 1C; supplemental Figure 3D-F; supplemental Table 3; Wilcoxon rank-sum test, fold change ≥2, Bonferroni adjusted P ≤ .05). Among these DEGs, 86.56% displayed altered expression in 1 cell type only (supplemental Figure 3G), indicating heterogeneous disease responses in HSPCs under the stress of bone marrow failure. Genes associated with cell death, cytokine signaling, and immune responses were significantly upregulated in AA, whereas mediators of cell-cycle control and differentiation were downregulated.7,8 Using scRNA-seq, we were able to further determine that several signal alterations were observed only within specific hematopoietic lineages (Figure 1D; supplemental Figure 4). For instance, Neu1 and MEPs were actively transcribing genes associated with cell death pathways, whereas transcripts linked with cytokine signaling were selectively increased in HSCs/MPPs, Neu2, and MD1/MD2. The majority of HSPCs displayed increased expression of genes involved in IFN-γ–mediated signaling, but MEP instead displayed decreased expression of these genes (supplemental Figure 4). Strikingly, we noted that a range of spliceosome genes were highly expressed in majority HSPC subsets, whereas transcription of genes that mediate mRNA polyA tails shortening were broadly repressed (Figure 1D). These findings suggest that splicing machinery is dysregulated in AA and may be key features of stressed hematopoiesis in AA bone marrow.
Transcription factors are crucial determinants of hematopoietic lineage commitment and specification, so we next analyzed transcription factor regulatory networks (regulons) using SCENIC.35 HSPCs were grouped into 7 clusters based on unique patterns of regulon activity (Figure 1E; supplemental Figure 5A-B), for instance, CEBPB-regulated networks were specifically activated in neutrophil progenitors, whereas GATA1- and TCF3-regulated networks were instead activated in MEPs and MLPs, respectively. Consistent with our previous analyses of gene expression data (Figure 1B; supplemental Figure 5C), regulon-based clustering confirmed that patients with AA displayed relative enrichment of Neu1 alongside marked depletion of HSCs/MPPs, MEPs, and MD1/MD2. Detailed analysis of differential regulon activities identified a total of 25 and 43 transcription factor regulatory networks that were dysregulated in non-SAA and SAA, respectively, but that these defects were distributed in a cell type–specific manner (Figure 1F-G; supplemental Figure 5D). For example, RUNX3 regulon displayed enhanced activity in HSCs/MPPs, the GATA2 regulon was instead deactivated in MEPs (Figure 1F). Indeed, the majority of regulatory networks appeared markedly repressed across the lineage-committed progenitor clusters (including R2 to R6), whereas other regulatory networks including HIVEP3 and CEBPE displayed enhanced activity in patient-derived HSC/MPP and Neu1 populations, respectively. Collectively, these results suggest that AA-linked disruption of the hematopoietic hierarchy is associated with a selective repression at the lineage-committed progenitor level.
Dysregulation of alternative splicing and polyadenylation
Having previously observed that a range of spliceosome genes were differentially expressed in HSPCs (Figure 1D; supplemental Figure 6A), we next sought to understand how alternative splicing events might affect hematopoiesis in patients with AA. We therefore obtained single-cell transcriptomes of 177 bone marrow–derived HSPCs from both AA and control by full-length scRNA-seq, representing HSC/MPP, LMPP, MEP, and Neu2 populations (supplemental Figure 6B). This analysis showed that progenitor cells from patients with AA displayed altered isoform usage for an average of 2431 genes (Figure 2A). Of note, splicing alterations in both stem and progenitor cells from patients with AA were dominated by exon skipping events, as exemplified by the endoplasmic reticulum lectin OS9 (Figure 2B; supplemental Figure 6C). We calculated that 17% of expression level changes in HSC/MPP could be attributed to alternative splicing (Figure 2C; supplemental Figure 6D-E). Notably, we observed that genes with altered isoform usage in AA were significantly enriched in DNA repair (FANCG, FANCA, FANCD2, ATM, BRCA2, and RAD51) and cell-cycle process (CDC16, CDC27, CCNB1, and CCND3), suggesting an unstable genomic state of residual HSPCs within bone marrow failure (Figure 2D; supplemental Table 4). For instance, variants of Fanconi anemia complementation members might disrupt DNA repair pathway, leading to genomic instability and accelerating DNA damage.43,44 Furthermore, these results were highly consistent among patients according to bulk RNA-seq of Lin−CD34+ HSPCs from 6 patients with AA (Figure 2E).
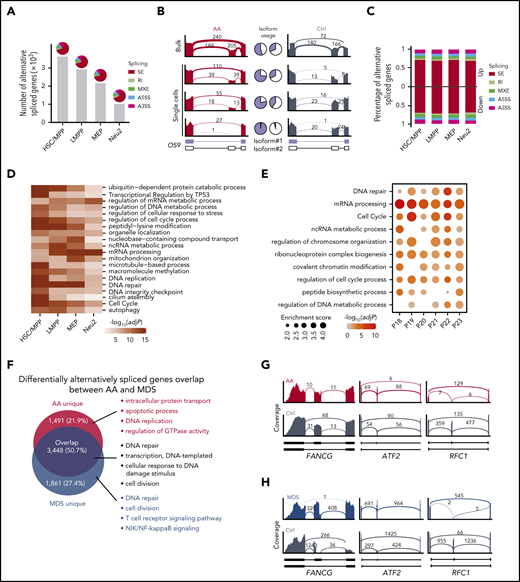
Alternative splicing events in HSPCs. (A) Number of genes that were differentially alternatively spliced in each HSPC subset. Pie charts illustrate the percentages of 5 types of splicing events. SE, skipped exon; RI, retained intron; MXE, mutually exclusive exons; A5SS, alternative 5′ splicing site; A3SS, alternative 3′ splicing site. (B) Representative display of differential OS9 exon usage in AA compared with control (Ctrl). Pie charts demonstrate the ratio of exon-exclusion isoform (blue, isoform#1) to exon-inclusion isoform (white, isoform#2). Bulk indicates the aggregation of single-cell data. (C) Percentage of different types of splicing events associated with up- or downregulated genes in AA. (D) Heat-map showing the top 20 enriched terms of differentially alternatively spliced genes in HSPCs. Colors indicate logarithmic transformed adjusted P values (Benjamini-Hochberg correction). (E) Enriched terms of differentially alternatively spliced genes between each patient with AA (n = 6) and 3 healthy controls based on bulk RNA-seq. Dot sizes represent enrichment scores and dot colors represent logarithmic transformed adjusted P values (Benjamini-Hochberg correction). (F) Venn diagram showing the overlap of differentially alternatively spliced genes in AA and MDS compared with Ctrl in aggregated HSPCs. Top 4 enriched GO terms ranked by P values (hypergeometric test) are shown for each gene set. Representative display of shared skipped exon events for DNA repair-associated genes in AA (G) and MDS (H) of aggregated HSPCs.
Alternative splicing events in HSPCs. (A) Number of genes that were differentially alternatively spliced in each HSPC subset. Pie charts illustrate the percentages of 5 types of splicing events. SE, skipped exon; RI, retained intron; MXE, mutually exclusive exons; A5SS, alternative 5′ splicing site; A3SS, alternative 3′ splicing site. (B) Representative display of differential OS9 exon usage in AA compared with control (Ctrl). Pie charts demonstrate the ratio of exon-exclusion isoform (blue, isoform#1) to exon-inclusion isoform (white, isoform#2). Bulk indicates the aggregation of single-cell data. (C) Percentage of different types of splicing events associated with up- or downregulated genes in AA. (D) Heat-map showing the top 20 enriched terms of differentially alternatively spliced genes in HSPCs. Colors indicate logarithmic transformed adjusted P values (Benjamini-Hochberg correction). (E) Enriched terms of differentially alternatively spliced genes between each patient with AA (n = 6) and 3 healthy controls based on bulk RNA-seq. Dot sizes represent enrichment scores and dot colors represent logarithmic transformed adjusted P values (Benjamini-Hochberg correction). (F) Venn diagram showing the overlap of differentially alternatively spliced genes in AA and MDS compared with Ctrl in aggregated HSPCs. Top 4 enriched GO terms ranked by P values (hypergeometric test) are shown for each gene set. Representative display of shared skipped exon events for DNA repair-associated genes in AA (G) and MDS (H) of aggregated HSPCs.
AA frequently develops into the severe blood malignancy MDS, with the latter accompanied by a high frequency of mutations in spliceosome genes.15,17,45 We therefore compared the splicing spectrum of patients with AA and MDS for aggregated HSPCs, which revealed that 50.7% of altered splicing events occurred in both disease types (Figure 2F; supplemental Figure 6F). Moreover, these shared alterations affected genes associated with DNA damage and repair responses such as FANCG, ATF2, and RFC1, which strikingly favored the same pattern of isoform usage in both AA and MDS (Figure 2G-H). In addition, majority HSPC subsets also shared splicing alterations enriched on DNA repair and cell-cycle signals between AA and MDS (supplemental Figure 6I). The subset of splicing alterations specific to MDS was associated with DNA repair, consistent with a higher burden of genomic damage in this disease, whereas those unique to AA were instead linked with apoptotic process, DNA replication, and intracellular protein transport (Figure 2F; supplemental Figure 6G-H). Collectively, these results demonstrate that AA and MDS exhibit similar defects in alternative splicing that are primarily associated with DNA repair, suggesting this may represent a critical mechanism of AA progression to MDS.
APA serves as a major source of transcriptional diversity that is thought to play a critical role in tumor development and progression.46-48 In patients with AA, we observed that genes responsible for regulating polyA tail shortening were broadly downregulated (Figure 1D), with an average of 1945 genes displaying altered polyA tail usage in stem and progenitor cells (Figure 3A). Each subgroup of cells possessed a unique set of APA-altered genes in AA, consistent with previous reports that APA alterations displayed marked cell-type specificity.49,50 We observed genes preferred modifications at distal polyA sites, including the lysine methyltransferase SETD251 and DNA repair mediator TDP1, whereas essential hematopoietic genes GATA2 and JAK2 were instead found to adopt a proximal conformation in HSCs/MPPs (Figure 3B; supplemental Figure 7A). Further integrative analysis of gene expression showed that 6.1% to 21.6% of APA-altered genes in HSPC subsets were differentially expressed as well (supplemental Figure 7B). Gene ontology (GO) enrichment analysis further indicated that genes with APA alterations in HSCs/MPPs were significantly enriched in DNA repair signaling (Figure 3C). Several DNA repair-associated genes with splicing alterations undergone aberrant APA in HSCs/MPPs as well, such as ATM, BRCA2, FANCG, RAD51C, and RAD51 (supplemental Table 4), suggesting that DNA repair signaling was dysregulated through both alternative splicing and polyadenylation in patients with AA. Alterations of APA events related to DNA repair signaling were further validated by bulk RNA-seq data (Figure 3D). In contrast, LMPPs, MEPs, and Neu2 shared APA changes that were preferentially associated with RNA processing genes. We further showed the regulatory networks mediated by competing-endogenous RNA (ceRNET) dramatically changed in HSPCs from AA (Figure 3E; supplemental Figure 7C). Together, these data identified the defects in both alternative splicing and APA usage that inhibit DNA repair in HSCs/MPPs derived from patients with AA.

Aberrant polyadenylation in HSPCs. (A) Heat-map showing genes (rows) with 3′ untranslated region (UTR) shortening (red) or lengthening (blue) in AA derived HSPCs. Bar plot shows the number of altered APA genes in each cell type (top). (B) Representative display of genes exhibiting 3′ UTR shortening (GATA2, JAK2) or lengthening (SETD2, TDP1) in HSC/MPP. Alternative usages of the 3′ UTR are highlighted by the dotted rectangles. (C) Top 5 enriched GO terms (ranked by logarithmic transformed adjusted P values, Benjamini-Hochberg correction) for altered APA genes in each HSPC subset. MBSP, multivesicular body sorting pathway; SDSA, synthesis-dependent strand annealing; TRBAN, transesterification reactions with bulged adenosine as nucleophile. (D) Enriched terms of differential APA genes between each patient with AA (n = 6) and 3 healthy controls (Ctrls) based on bulk RNA-seq. Dot sizes represent enrichment scores and dot colors represent logarithmic transformed adjusted P values (Benjamini-Hochberg correction). (E) Pie charts showing the number of ceRNA pairs shared between AA and Ctrl (blue). AA-specific ceRNA pairs (red) and control-specific ceRNA pairs (gray) have also been highlighted.
Aberrant polyadenylation in HSPCs. (A) Heat-map showing genes (rows) with 3′ untranslated region (UTR) shortening (red) or lengthening (blue) in AA derived HSPCs. Bar plot shows the number of altered APA genes in each cell type (top). (B) Representative display of genes exhibiting 3′ UTR shortening (GATA2, JAK2) or lengthening (SETD2, TDP1) in HSC/MPP. Alternative usages of the 3′ UTR are highlighted by the dotted rectangles. (C) Top 5 enriched GO terms (ranked by logarithmic transformed adjusted P values, Benjamini-Hochberg correction) for altered APA genes in each HSPC subset. MBSP, multivesicular body sorting pathway; SDSA, synthesis-dependent strand annealing; TRBAN, transesterification reactions with bulged adenosine as nucleophile. (D) Enriched terms of differential APA genes between each patient with AA (n = 6) and 3 healthy controls (Ctrls) based on bulk RNA-seq. Dot sizes represent enrichment scores and dot colors represent logarithmic transformed adjusted P values (Benjamini-Hochberg correction). (E) Pie charts showing the number of ceRNA pairs shared between AA and Ctrl (blue). AA-specific ceRNA pairs (red) and control-specific ceRNA pairs (gray) have also been highlighted.
Predicted enhancement of HSPCs crosstalk with T-cell subsets
T lymphocytes are reported to be hyperactivated in AA and may directly damage HSPCs residing in the bone marrow.52-54 To better understand the molecular basis for this, we next obtained 4081 single-cell transcriptomes of CD4+ and CD8+ T cells derived from both bone marrow and peripheral blood of the same donors (supplemental Figure 1A-B,E-F). As anticipated, CD4+ and CD8+ T cells were formed of 3 distinct clusters with known signature genes, representing naïve, memory, and effector cell compartments (Figure 4A; supplemental Figure 8A-B; supplemental Table 5). The cellular makeup of these compartments varied significantly among patients (supplemental Figure 8C-D).
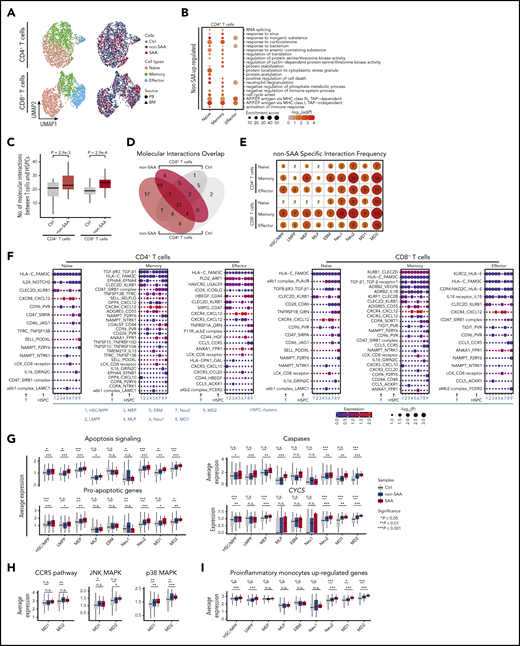
HSPC molecular interactions with T cells. (A) UMAP visualization of single T cells derived from bone marrow (triangles) or peripheral blood (circles) from SAA (dark red, n = 4), non-SAA (dark blue, n = 11) or Ctrl (dark gray, n = 2). Colors indicate naïve cells (red), memory cells (green), and effector cells (blue). (B) Top 20 GO terms enriched among the genes upregulated in CD4+ T cells from patients with non-SAA (n = 11). Dot color indicates the logarithmic transformed adjusted P value (Benjamini-Hochberg correction). Dot size indicates enrichment score estimated by Metascape. Abbreviation: AP.P.EP, antigen processing and presentation of exogenous peptide. (C) Box plots indicating a significantly increased number of HSPCs molecular interactions with CD4+ and CD8+ T cells in non-SAA (HSPCs, n = 12; T cells, n = 11; Student t test). (D) Venn diagram displaying the overlap of molecular interactions between CD4+ and CD8+ T cells in non-SAA (HSPCs, n = 12; T cells, n = 11). (E) Number of non-SAA–specific molecular interactions in each T-cell subset and HSPCs. Gradient color and dot size indicate relative abundance of molecular interactions. (F) Spectrum of ligand-receptor pairs (rows) between HSPCs and T cells (columns) as observed in patients with non-SAA (HSPCs, n = 12; T cells, n = 11). Dot sizes and colors represent logarithmic transformed P values (permutation test) and mean expression of interacting molecules in corresponding cell subsets. (G) Average expression of apoptosis signaling genes and critical components in this signaling pathway. *P ≤ .05; **P ≤ .01; ***P ≤ .001; Wilcoxon rank-sum test. (H) Average expression of CCR5 pathway genes and critical components in this signaling pathway. (I) Average expression of upregulated genes in proinflammatory monocytes in autoimmune disease.
HSPC molecular interactions with T cells. (A) UMAP visualization of single T cells derived from bone marrow (triangles) or peripheral blood (circles) from SAA (dark red, n = 4), non-SAA (dark blue, n = 11) or Ctrl (dark gray, n = 2). Colors indicate naïve cells (red), memory cells (green), and effector cells (blue). (B) Top 20 GO terms enriched among the genes upregulated in CD4+ T cells from patients with non-SAA (n = 11). Dot color indicates the logarithmic transformed adjusted P value (Benjamini-Hochberg correction). Dot size indicates enrichment score estimated by Metascape. Abbreviation: AP.P.EP, antigen processing and presentation of exogenous peptide. (C) Box plots indicating a significantly increased number of HSPCs molecular interactions with CD4+ and CD8+ T cells in non-SAA (HSPCs, n = 12; T cells, n = 11; Student t test). (D) Venn diagram displaying the overlap of molecular interactions between CD4+ and CD8+ T cells in non-SAA (HSPCs, n = 12; T cells, n = 11). (E) Number of non-SAA–specific molecular interactions in each T-cell subset and HSPCs. Gradient color and dot size indicate relative abundance of molecular interactions. (F) Spectrum of ligand-receptor pairs (rows) between HSPCs and T cells (columns) as observed in patients with non-SAA (HSPCs, n = 12; T cells, n = 11). Dot sizes and colors represent logarithmic transformed P values (permutation test) and mean expression of interacting molecules in corresponding cell subsets. (G) Average expression of apoptosis signaling genes and critical components in this signaling pathway. *P ≤ .05; **P ≤ .01; ***P ≤ .001; Wilcoxon rank-sum test. (H) Average expression of CCR5 pathway genes and critical components in this signaling pathway. (I) Average expression of upregulated genes in proinflammatory monocytes in autoimmune disease.
We found that majority of DEGs were upregulated in patients (supplemental Table 6). In patients with non-SAA, antigen presentation-associated genes were highly activated in CD4+ T cells (Figure 4B). Notably, we also observed marked enrichment of cell death regulation genes in CD4+ naïve and memory T cells, which might contribute to overall decline of the CD4+ T cell pool. In parallel, CD8+ T cells displayed high expression of genes associated with cytokine production (supplemental Figure 8E). In patients with SAA, CD8+ effector T cells also displayed active transcription of genes related to antigen processing (supplemental Figure 8F), while CD4+ naïve T cells showed higher expression of T-cell activation and immune response signaling (supplemental Figure 8G). By further looking into gene sets associated with T-cell function, we found that CD4+ memory and effector T cells highly expressed genes associated with activation and exhaustion in both patients with non-SAA and SAA. Repression related genes are only significantly highly expressed in patients with SAA. In CD8+ memory and effector T cells, genes associated with activation, exhaustion, and cytokines were highly expressed in SAA (supplementary Figure 8H-J). These data indicate that SAA differs from milder disease in terms of T-cell activation, antigen processing, and survival within both the CD4+ and CD8+ compartments. In particular, the increased cell death signal in CD4+ naïve and memory T cells might be involved in the reduced quantity of CD4+ T cells.
We next aimed to elucidate the molecular basis of HSPCs crosstalk with T cells by assessing the transcriptional activity of paired ligand receptor. In this analysis, we detected 62 cell type–specific ligand-receptor pairs in non-SAA and 68 in SAA that were actively expressed in subsets of HSPCs and T cells (Figure 4F; supplemental Table 7). The total number of HSPCs interactions with CD4+ and CD8+ T cells was significantly increased in patients (Figure 4C-E; supplemental Figure 9C). Among these predicted molecule interactions, FAS/FASL4,53 and TNF receptors/TNF-α6,8,25 have previously been implicated in immune-mediated disruption of hematopoietic cells via induction of apoptosis signaling in HSPCs. We further observed that TGF-β and TNFSF10/FASL involved apoptosis signaling was broadly activated in HSPC subsets in AA (Figure 4F, G; supplemental Figures 9B, 10C, and 11C), which might contribute to the high expression of cell death signaling and reduction of HSPCs (Figure 1D). In addition, CCL5_CCR5 mediated inflammatory response and key components (JNK and p38 MAPK signal) were upregulated in MD1/MD2 in AA (Figure 4H), which was consistent with the alterations in cytokine-mediated signaling pathway in MD1/MD2 (supplemental Figure 4). Moreover, proinflammatory genes in MD1/MD2 and inflammatory cytokines in memory and effector T cells were enhanced in AA (Figure 4I; supplemental Figure 8H-I). These results suggest that immune dysfunctions in monocyte/dendritic progenitors may stimulate cytokine secretion by T cells, and thus accelerate bone marrow failure.
We further analyzed differences in HSPC–T cell crosstalk between patients with SAA and non-SAA, which indicated that 32 distinct molecular interactions were specific features of severe condition, whereas 15 ligand-receptor pairs were instead restricted to mild disease only (supplemental Figure 9). In the majority of cases, molecular interactions were shared by T cells derived from bone marrow and peripheral blood (supplemental Figures 10 and 11), supporting the notion that hematopoietic destruction in AA is mediated by both circulating and marrow-infiltrating lymphocytes.19,55 However, only bone marrow–derived CD8+ T cells displayed enhanced expression of TGF-β and FASL, suggesting the existence of some unique interactions between bone marrow–derived T cells and HSPCs.
Partially improved hematopoiesis after immunosuppressive therapy
To track the cellular and molecular dynamics that support the remission of bone marrow failure after immunosuppressive therapy, we further sequenced single-cell transcriptomes of 1010 HSPCs and 1099 T cells from 5 patients with non-SAA responsive to cyclosporine A plus androgens treatment in our cohort (Figure 5A-B; supplemental Figure 12A-B). The cellular compositions were approaching to a normal distribution after treatment. Concretely, LMPPs and MLPs were reduced, whereas MEP and Neu2 were increased, indicating a rescued shift in the frequencies of lymphoid vs myeloid progenitors following immune interferences (Figure 5C; supplemental Figure 12C). However, the frequencies of MD1/MD2 were further decreased after treatment, suggesting that the monocyte/dendritic progenitors might be involved in disease development.6,56 We found that upregulated genes in patient MD2 cells including HLA-B, MT2A, and HLA-DRB1 enriched in IFN-γ–mediated signaling pathway, whereas downregulated genes were associated with response to steroid hormone signal that involved in communications between dendritic cells and T cells57 (Figure 5D). In addition, CD4+ effector T cells showed a significant increase in cellular frequencies after treatment (supplemental Figure 12D), which might contribute to the CD4+/CD8+ T-cell ratio shift after immunosuppressive therapy. Meanwhile, the immunosuppression-related genes were upregulated after treatment in CD4+ effector T cells (supplemental Figure 12E), suggesting that these effector cells might enhance their immunosuppression capability after treatment.

Transcriptome dynamics of HSPCs and T cells and their crosstalk after immunosuppressive therapy. (A) Diagram of tracking patients with non-SAA (n = 5) responsive to immunosuppressive treatment. Characteristics of each patient are shown on the left table; days of follow-up relative to diagnosis and the time points for sample collection are shown on the right accordingly. (B) UMAP display of HSPCs based on single-cell transcriptomes. Each dot represents a single cell; colors indicate cell clusters (left) and source of donors (right) (untreated, n = 12; treated, n = 5). (C) Bar plot showing the ratio of observed to expected cell numbers of each cell type in patients with both untreated and treated samples (n = 5). Dots indicate individual patients and dot sizes indicate logarithmic transformed P values (χ2 test). Error bars represent ± standard error of the mean. Student t test was used for differential comparison between untreated and treated. (D) Volcano plot showing the DEGs of MD2 in treatment-naïve patients (n = 12) compared with control (Ctrl). Each dot represents a single gene; the black dots represent DEGs (fold change using default parameters in Seurat with Bonferroni adjusted P ≤ .05). Selected enriched GO terms of downregulated and upregulated genes in treatment-naïve patients are shown on the top. Genes with blue and red colors are related to response to steroid hormone and IFN-γ–mediated signaling pathway, respectively. (E) Bar plot displays the number of DEGs between different donor groups in HSPCs (untreated, n = 12; treated, n = 5). (F) Line chart showing the expression dynamics of 4 gene sets in Ctrl and different time points of patients with non-SAA illustrating milder hematopoietic improvement after treatment (left) (untreated, n = 12; treated, n = 5). The number in the middle means the number of genes sharing the same expression pattern in each cluster. Enriched GO terms in each cluster were shown on the right. (G) Molecular interaction states of 55 ligand-receptor pairs (rows) between HSPCs and T cells (columns) in non-SAA after immunosuppressive treatment (n = 5). Molecules in gray indicate that they were downregulated in T cells or HSPCs. Dot sizes and colors represent logarithmic transformed P values (permutation test) and mean expression of interacting molecules in corresponding cell subsets.
Transcriptome dynamics of HSPCs and T cells and their crosstalk after immunosuppressive therapy. (A) Diagram of tracking patients with non-SAA (n = 5) responsive to immunosuppressive treatment. Characteristics of each patient are shown on the left table; days of follow-up relative to diagnosis and the time points for sample collection are shown on the right accordingly. (B) UMAP display of HSPCs based on single-cell transcriptomes. Each dot represents a single cell; colors indicate cell clusters (left) and source of donors (right) (untreated, n = 12; treated, n = 5). (C) Bar plot showing the ratio of observed to expected cell numbers of each cell type in patients with both untreated and treated samples (n = 5). Dots indicate individual patients and dot sizes indicate logarithmic transformed P values (χ2 test). Error bars represent ± standard error of the mean. Student t test was used for differential comparison between untreated and treated. (D) Volcano plot showing the DEGs of MD2 in treatment-naïve patients (n = 12) compared with control (Ctrl). Each dot represents a single gene; the black dots represent DEGs (fold change using default parameters in Seurat with Bonferroni adjusted P ≤ .05). Selected enriched GO terms of downregulated and upregulated genes in treatment-naïve patients are shown on the top. Genes with blue and red colors are related to response to steroid hormone and IFN-γ–mediated signaling pathway, respectively. (E) Bar plot displays the number of DEGs between different donor groups in HSPCs (untreated, n = 12; treated, n = 5). (F) Line chart showing the expression dynamics of 4 gene sets in Ctrl and different time points of patients with non-SAA illustrating milder hematopoietic improvement after treatment (left) (untreated, n = 12; treated, n = 5). The number in the middle means the number of genes sharing the same expression pattern in each cluster. Enriched GO terms in each cluster were shown on the right. (G) Molecular interaction states of 55 ligand-receptor pairs (rows) between HSPCs and T cells (columns) in non-SAA after immunosuppressive treatment (n = 5). Molecules in gray indicate that they were downregulated in T cells or HSPCs. Dot sizes and colors represent logarithmic transformed P values (permutation test) and mean expression of interacting molecules in corresponding cell subsets.
We next investigated the transcriptome dynamics by comparing HSPCs or T cells in treated patients with treatment-naïve state and healthy controls. According to the number of DEGs, we found that patients after treatment were much closer to treatment-naïve state at the whole transcriptome level (Figure 5E; supplemental Figure 12F). This result indicates that the transcriptomes of HSPCs and T cells are still at abnormal states even though the patients are responsive to treatment, in concordance with the long-term requirement of clinical interferences to maintain stable hematopoiesis. Nevertheless, we observed a milder recovery of genes associated with hematopoiesis. Specifically, genes involved in cell differentiation (NFE2, HES1) were initially downregulated in treatment-naïve patients and further increased their expression levels after treatment in HSC/MPP. In addition, genes related to lymphoid (FYB1, LGALS1) and erythroid lineages (GATA2, ZFP36L2) were approaching normal expression levels as well (Figure 5F; supplemental Figure 12G). Altogether, transcriptome profiling of HSPCs and T cells from patients responsive to immunosuppressive therapy showed shifts toward healthy states at both cellular composition and molecule levels, but were accompanied by global abnormal gene transcription.
To evaluate the effects of immunosuppressive treatment on crosstalk between HSPCs and T cells, we assessed the molecular interactions in treated patients. We found that 31 cell type–specific interactions were inactivated after treatment (Figure 5G). Among them, 21 interactions were inactivated because of low expression of ligands/receptors in T cells, supporting the pharmacological mechanism that cyclosporine A has the most direct effect on T cells. For example, CCL5_CCR5 that stimulates inflammatory response was inactivated because CCL5 was downregulated in T cells after treatment (supplemental Figure 12H). By contrast, 9 interactions disappeared through low expression of ligands/receptors in HSPCs. Notably, interleukin-18 and its receptor were significantly downregulated in HSPCs and T cells, respectively, consistent with a reflection of aberrant immune response though illustrating dispensable to the pathogenesis of AA.58 However, the other cell type–specific molecular pairs were still actively interacted in HSPCs and T cells, including pairs of TGF-β1_TGF-β receptor1. These therapy insensitive interactions might play a sustained role in mediating immune attack and be potential targets for combinatorial interferences to improve prognosis of patients with AA. In addition, a total of 57 molecular interactions newly emerged after immunosuppressive therapy, mainly involved in immune responses (CD40LG_CD40, ANXA1_FPR2), cellular adhesion (aLb2 complex_ICAM1, PECAM1_CD177), and cell proliferation (EGFR_TGF-β1, EGFR_EREG) (supplemental Figure 12I). Notably, CD40LG_CD40 that regulates anti-apoptotic signaling59 arose between CD4+ effector T cells and MEP, suggesting a role of CD40LG_CD40–mediated interaction in cell survival and inhibiting apoptosis in hematopoietic cells.
Discussion
“Empty” bone marrow is a typical morphological feature of patients with AA. But the nature of the residual HSPC subsets has never been uncovered, and the interaction between autoreactive T cells and HSPCs has not yet been delineated.2,3 With the aid of scRNA-seq, to our knowledge, the abnormal transcriptomes of individual HSPCs are revealed for the first time in patients with AA. We show that the hematopoietic process at lineage-committed progenitor level is largely impaired, manifested by lineage selective destruction. Importantly, alternative splicing events and skewed APA alterations in early progenitors represent novel molecular features of residual hematopoiesis in AA bone marrow, involving a range of effects on DNA damage and repair responses that are commonly found in MDS. Here, we provide a new point, alternative splicing events, to disclose the pathophysiologic association between AA and MDS.
Moreover, we focus on the crosstalk between HSPCs and autoreactive T cells, and further uncover a series of specific molecular interactions that likely represent mediators of ongoing immune suppression in the patients. In addition to molecular interactions that reflect successful immune interferences and may explain the underpinnings of primary immune attack, we further identify ligands and receptors that remain active after treatment. Potentially, these treatment insensitive interactions may be targets of further clinical treatment.
However, there is also a limitation to our study. Although all the patients have been assessed by detailed inquiry of family history, physical examination for extrahematopoietic abnormalities, and bone marrow cytogenetics, we cannot entirely exclude the low possibility of germline causes of marrow failure disorders, such as the telomeropathies, because of lacking a genetic screening test.
Together, our current study reports the transcriptomic definition of AA at single-cell resolution. These findings not only provide new insights into the pathophysiology of aplastic anemia, but also offer opportunities to develop new therapies for promoting hematopoietic recovery and preventing malignant transformation in patients with AA.
The publication costs of this article were defrayed in part by page charge payment. Therefore, and solely to indicate this fact, this article is hereby marked “advertisement” in accordance with 18 USC section 1734.
RNA-seq data are deposited in the Gene Expression Omnibus database under accession number GSE145669. Codes for bioinformatics analysis are freely available at https://github.com/CaiyingZhu/Code-for-aplastic-anemia.git.
The online version of this article contains a data supplement.
Acknowledgments
The authors thank Neal Young for insightful and encouraging comments about our work and also appreciate the valuable input and great help from their laboratory members.
This work was supported by National Key Research and Development Program of China (2016YFA0100600 and 2018YFA0107804), the National Natural Science Foundation of China (82022002, 81900117, 81890993, 81670120, 81890990, 81730006, 81421002, 81861148029), the Fundamental Research Funds for the Central Research Institutes (2020-RC310-005), Chinese Academy of Medical Sciences (CAMS) Initiative for Innovative Medicine (2016-I2M-1-017, 2017-I2M-1-015, 2017-I2M-3-009, 2017-I2M-3-018, 2019-I2M-2-001), and the Tianjin Municipal Science and Technology Commission Major Project (18ZXDBSY00070).
Authorship
Contribution: P.Z., J.S., and T.C. conceived the study; C.Z., Y.L., C.W., Y.G., S.F., L.A., L.F., and H.P. performed the single-cell experiments; C.Z., P.W., and X.L. did the bioinformatics data analysis; and P.Z., J.S., and T.C. wrote the manuscript with the help from all the authors.
Conflict-of-interest disclosure: The authors declare no competing financial interests.
Correspondence: Ping Zhu, State Key Laboratory of Experimental Hematology, National Clinical Research Center for Blood Diseases, Institute of Hematology and Blood Diseases Hospital, No. 288 Nanjing Rd, Heping District, Tianjin 300020, China; e-mail: zhuping@ihcams.ac.cn; Jun Shi, State Key Laboratory of Experimental Hematology, National Clinical Research Center for Blood Diseases, Regenerative Medicine Clinic, Institute of Hematology and Blood Diseases Hospital, No. 288 Nanjing Rd, Heping District, Tianjin 300020, China; e-mail: shijun@ihcams.ac.cn; and Tao Cheng, State Key Laboratory of Experimental Hematology, National Clinical Research Center for Blood Diseases, Institute of Hematology and Blood Diseases Hospital, No. 288 Nanjing Rd, Heping District, Tianjin 300020, China; e-mail: chengtao@ihcams.ac.cn.

This feature is available to Subscribers Only
Sign In or Create an Account Close Modal