

TO THE EDITOR:
Hemoglobin (α2β2) is encoded by the α- and β-globin gene clusters. Analyses of mutations within the α-globin cluster that downregulate α-globin expression (α-thalassemia) provide the basis for genetic counseling and prenatal diagnosis of this common form of anemia.1 Understanding the mechanisms by which such mutations cause α-thalassemia has established many of the principles by which mammalian genes are regulated and how human genetic disease can occur. Here we describe an individual with a unique α-globin genotype which addresses how the human α-globin cluster is normally regulated.
The α-globin cluster on chromosome 16 (16p13.3) includes an embryonic ζ-globin gene and duplicated α-globin genes (αα/αα) arranged in the order 5′-ζ-α2-α1-3′. α-Globin transcription is regulated by 4 cis-acting enhancers (R1-R4) located 10 to 48 kb upstream of the α-gene cluster (Figure 1A). Previous studies have shown that in human R1 and R2 are the most important enhancers, accounting for ∼10% and ∼90% of α-globin expression, respectively.2-4
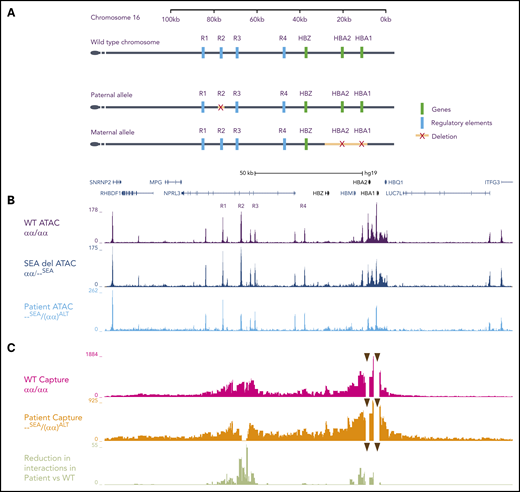
Schematic representation of the human α-globin cluster: characterization of open chromatin and chromatin interaction profiles. (A) Schematic diagrams of the α-globin locus located in the subtelomeric region of chromosome 16. The top track represents the wild-type (WT) locus (αα). The tracks beneath represent the 2 alleles inherited by the patient. For clarity, intervening genes and structural elements are not included. The paternal allele is (αα)ALT and the maternal allele is --SEA. (B) The open chromatin landscape at the α-globin locus (ATAC-seq) in primary erythroid cells on day 13 of erythroid differentiation. The top track is generated from cells derived from 3 unrelated WT controls (αα/αα), the middle is from a carrier of the SEA mutation (αα/--SEA), and the bottom is from the patient (--SEA/(αα)ALT). In the patient’s cells, marked reduction in ATAC signal is observed at the R2 enhancer and the α-globin genes. No new peaks are seen. Genes and pseudogenes are annotated below the scale bar. (C) Chromatin interaction profiles between the α-globin promoters (arrowheads) and the surrounding chromatin in primary erythroid cells (Capture-C). Peaks along the track represent interactions with the α-globin promoters. Although there are increased interactions with chromatin adjacent to the promoters due to proximity effects, in the WT setting, there is a marked increase in interactions with chromatin regions containing the enhancers, even though they lie up to 70-kb away. The top track depicts the mean interaction profile observed in cells from three unrelated WT controls (αα/αα), and the middle track is the interaction profile observed in cells taken from the patient, which shows an absence of interactions between the α-globin promoters and R2, in keeping with its deletion on that allele. The bottom track depicts the reduction in interactions when comparing the patient and the WT controls, represented as log-adjusted P values. There is a highly significant reduction in interactions between the α-globin promoters and R2 because of its deletion, and a modest reduction in interactions between the promoters and R1, R3, and R4. Intersection of the Capture-C, ATAC-seq, and dbSNP data reveals that this reduction in interactions in cis with the deleted R2 is also matched by reduced chromatin accessibility on the same allele at R3 as measured by ATAC-seq (the patient did not have any SNPs in R1 or R4 so these could not be assessed). SNP, single nucleotide polymorphism.
Schematic representation of the human α-globin cluster: characterization of open chromatin and chromatin interaction profiles. (A) Schematic diagrams of the α-globin locus located in the subtelomeric region of chromosome 16. The top track represents the wild-type (WT) locus (αα). The tracks beneath represent the 2 alleles inherited by the patient. For clarity, intervening genes and structural elements are not included. The paternal allele is (αα)ALT and the maternal allele is --SEA. (B) The open chromatin landscape at the α-globin locus (ATAC-seq) in primary erythroid cells on day 13 of erythroid differentiation. The top track is generated from cells derived from 3 unrelated WT controls (αα/αα), the middle is from a carrier of the SEA mutation (αα/--SEA), and the bottom is from the patient (--SEA/(αα)ALT). In the patient’s cells, marked reduction in ATAC signal is observed at the R2 enhancer and the α-globin genes. No new peaks are seen. Genes and pseudogenes are annotated below the scale bar. (C) Chromatin interaction profiles between the α-globin promoters (arrowheads) and the surrounding chromatin in primary erythroid cells (Capture-C). Peaks along the track represent interactions with the α-globin promoters. Although there are increased interactions with chromatin adjacent to the promoters due to proximity effects, in the WT setting, there is a marked increase in interactions with chromatin regions containing the enhancers, even though they lie up to 70-kb away. The top track depicts the mean interaction profile observed in cells from three unrelated WT controls (αα/αα), and the middle track is the interaction profile observed in cells taken from the patient, which shows an absence of interactions between the α-globin promoters and R2, in keeping with its deletion on that allele. The bottom track depicts the reduction in interactions when comparing the patient and the WT controls, represented as log-adjusted P values. There is a highly significant reduction in interactions between the α-globin promoters and R2 because of its deletion, and a modest reduction in interactions between the promoters and R1, R3, and R4. Intersection of the Capture-C, ATAC-seq, and dbSNP data reveals that this reduction in interactions in cis with the deleted R2 is also matched by reduced chromatin accessibility on the same allele at R3 as measured by ATAC-seq (the patient did not have any SNPs in R1 or R4 so these could not be assessed). SNP, single nucleotide polymorphism.
Previously reported patients have inherited chromosomes in which R2 is deleted with or without deletions of the other enhancers.1,5-9 Of importance, heterozygotes for a deletion removing both R1 and R2 have a hematological phenotype indistinguishable from those with a deletion of both α-globin genes (--/αα), with a reduction in mean corpuscular volume and mean corpuscular hemoglobin together with occasional red cells containing hemoglobin H (HbH; β4) inclusions. This suggests that R3 and R4 provide little, if any, enhancer activity, consistent with similar findings in mouse.10 Individuals who inherit a single allele in which just R2 is deleted [(αα)ΔR2/αα] have a phenotype that appears milder than the --/αα genotype with no HbH inclusions seen in the peripheral blood.5,11 This is consistent with residual activity from R1. An individual homozygous for a 3.3-kb deletion including R2 [(αα)ALT/(αα)ALT] has HbH disease with a severe hematological phenotype.3,5
We report a 26-year-old office worker of mixed ethnic origin, who has a hematologically very severe form of α-thalassemia. Despite this, she has only received 2 previous transfusions as a child, which were associated with concurrent infections. Growth and development were normal. She participated in normal childhood sports, although “feeling tired” during them. Ultrasound showed splenomegaly but no hepatomegaly. Hematological analysis revealed a severe hypochromic, microcytic anemia, and HbH inclusions in 30.7% of cells, but no evidence of iron overload (Figure 2A-C; supplemental Table 1, available on the Blood Web site). Genotypic analysis showed that both α-globin genes are deleted from her maternal allele (--SEA). Therefore, all α-globin transcription in this patient comes from her paternal allele affected by a previously reported mutation [(αα)ALT] in which R2 is deleted (Figures 1A and 2D). From this paternal allele, R1 alone drives expression of the 2 α-globin genes in cis. The patient thus produces only 50% of the α-globin produced by the previously described (αα)ALT/(αα)ALT homozygote with severe HbH disease: the total α-globin output compared with normal would be predicted to be 0% from the maternal (--SEA) allele, and just 5% from the (αα)ALT allele. Given such a severe predicted reduction, it was surprising that the patient survives without transfusions. Of interest, this patient is heterozygous for HbE (βA/βE) and therefore her genotype is consistent with that seen in patients with AE Bart disease.12
![Hematological characterization and family pedigree. The patient originates from Surinam, a country with mixed ethnicity on the northeast Atlantic coast of South America. (A) Red blood cell parameters at the time of diagnosis of the patient and her parents. HbH inclusions were manually counted from a blood smear prepared after staining whole blood in an equal volume of Brilliant Cresyl Blue (BCB). Glycolytic enzyme analysis of the patient’s blood indicated the red blood cell population was composed of young cells, although the reticulocyte count was not markedly raised (hexokinase, 5.8 [normal range, 0.8-1.5], pyruvate kinase, 27.3 [6.1-12.3 U/g Hb], reticulocyte count, 127 × 109/L). *Reference values are for nondeletional HbH disease, which is more severe than the deletional form.15 (B) Peripheral blood smear, Giemsa stained, from the patient. which shows marked hypochromia and anisopoikilocytosis (indicated by arrowheads) consistent with a diagnosis of hematologically severe HbH disease. (C) Peripheral blood HbH smear, BCB stained, from the patient. Arrowheads indicate typical cells containing HbH inclusions. (D) Family pedigree of the patient with annotated genotypes. Micrographs were taken using an Olympus BX60 microscope with an oil immersion 100× lens and Infinity 3S Lumenera camera. Hct, hematocrit; MCV, mean corpuscular volume; MCH, mean cell hemoglobin.](https://ash.silverchair-cdn.com/ash/content_public/journal/blood/137/4/10.1182_blood.2020006680/2/m_bloodbld2020006680f2.png?Expires=1770140928&Signature=rM7XwhCf4ZcFtPDSTaZwh9gW9UlonKNduZvYH~sbzgX-0AbBZPalU2kcYd1nxQw5IDFb~e2XmvsQILcRJaBjRhhp3RdSnEzrl1VDvpAuCNgUOdbw~2jSrOFQmq9GZvs4w-t6pwoQwzkN4x3O25~CQMTSFSE6YLeoX3~81FgLOKJyVfV76TIex0O2bY~X6PA4Kg704x-QCkltFXk5Jk4IL1jv3THGn1pGXKZHQ~YAZFiiTu7DAMuY7ByAHotWNaNW219EJv0Xgm4xdQjyyPg6idtOtVHkkaAbLp6xJc9KA24CIpv9Q4ZFON~-IZW58-58JN19CeP8QkXQ6wFWl3g-YA__&Key-Pair-Id=APKAIE5G5CRDK6RD3PGA)
Hematological characterization and family pedigree. The patient originates from Surinam, a country with mixed ethnicity on the northeast Atlantic coast of South America. (A) Red blood cell parameters at the time of diagnosis of the patient and her parents. HbH inclusions were manually counted from a blood smear prepared after staining whole blood in an equal volume of Brilliant Cresyl Blue (BCB). Glycolytic enzyme analysis of the patient’s blood indicated the red blood cell population was composed of young cells, although the reticulocyte count was not markedly raised (hexokinase, 5.8 [normal range, 0.8-1.5], pyruvate kinase, 27.3 [6.1-12.3 U/g Hb], reticulocyte count, 127 × 109/L). *Reference values are for nondeletional HbH disease, which is more severe than the deletional form.15 (B) Peripheral blood smear, Giemsa stained, from the patient. which shows marked hypochromia and anisopoikilocytosis (indicated by arrowheads) consistent with a diagnosis of hematologically severe HbH disease. (C) Peripheral blood HbH smear, BCB stained, from the patient. Arrowheads indicate typical cells containing HbH inclusions. (D) Family pedigree of the patient with annotated genotypes. Micrographs were taken using an Olympus BX60 microscope with an oil immersion 100× lens and Infinity 3S Lumenera camera. Hct, hematocrit; MCV, mean corpuscular volume; MCH, mean cell hemoglobin.
Hematological characterization and family pedigree. The patient originates from Surinam, a country with mixed ethnicity on the northeast Atlantic coast of South America. (A) Red blood cell parameters at the time of diagnosis of the patient and her parents. HbH inclusions were manually counted from a blood smear prepared after staining whole blood in an equal volume of Brilliant Cresyl Blue (BCB). Glycolytic enzyme analysis of the patient’s blood indicated the red blood cell population was composed of young cells, although the reticulocyte count was not markedly raised (hexokinase, 5.8 [normal range, 0.8-1.5], pyruvate kinase, 27.3 [6.1-12.3 U/g Hb], reticulocyte count, 127 × 109/L). *Reference values are for nondeletional HbH disease, which is more severe than the deletional form.15 (B) Peripheral blood smear, Giemsa stained, from the patient. which shows marked hypochromia and anisopoikilocytosis (indicated by arrowheads) consistent with a diagnosis of hematologically severe HbH disease. (C) Peripheral blood HbH smear, BCB stained, from the patient. Arrowheads indicate typical cells containing HbH inclusions. (D) Family pedigree of the patient with annotated genotypes. Micrographs were taken using an Olympus BX60 microscope with an oil immersion 100× lens and Infinity 3S Lumenera camera. Hct, hematocrit; MCV, mean corpuscular volume; MCH, mean cell hemoglobin.
To investigate further, CD34+ cells were selected from peripheral blood and differentiated along the erythroid lineage.13 At peak globin production, the α/β-globin messenger RNA (mRNA) ratio was markedly reduced when compared with wild-type cells (αα/αα) and those of a patient carrying the --SEA deletion (αα/--SEA) (supplemental Figure 1). Even so, the reduction in α-globin expression was not as great as predicted. These findings initially suggested that the other enhancers on this allele may compensate for the loss of R2.
We therefore asked if the remaining enhancers (R1, R3, and R4) or previously unknown enhancers on the (αα)ALT allele may have compensated for the loss of R2. Enhancers can be identified by their accessibility to transposases (ATAC-seq), reflecting their accessibility to transcription factors in vivo. We observed a reduction in the ATAC peak corresponding to R2 (Figure 1B), in keeping with its deletion from one allele. However, we did not observe any new peaks forming in a 150-kb region including and surrounding the α-globin genes, or any compensatory increase in the peak heights of the remaining enhancers, although functional alterations in transcription factor binding without changes in accessibility cannot be ruled out. Consistent with the reduction in α-globin transcription, there was a reduction in ATAC signal over the α-globin genes compared with control. No significant changes were observed at the β-globin locus (not shown).
We next determined if interactions between the enhancers and promoters had changed. Capture-C, a sensitive assay to detect physical interactions between selected regions of chromatin, was performed.14 When capturing from the intact α-globin promoters, present only on 1 allele in cis with the R2 deletion, no interactions with R2 were detected. This clearly shows that the single copy of R2 in trans on the --SEA allele was not interacting with the α-globin genes on the other allele and therefore not driving α-globin expression. Surprisingly, when compared with 3 normal controls, interactions between the α-globin promoters and the intact R1, R3, and R4 enhancers on the (αα)ALT allele were also reduced rather than enhanced as might be expected if they were compensating for the loss of R2 (Figure 1C).
Why was the phenotype not as severe as expected? The patient appears to have a well-compensated hemolytic anemia with no evidence of significant ineffective erythropoiesis. The α/β-globin mRNA ratio was lower than reported from most patients with HbH disease.1 ζ-globin was not significantly activated to compensate for the loss of α-globin (supplemental Figure 2A-C). One ameliorating factor may have been the co-inheritance of the βE mutation that acts as a mild form of β-thalassemia, thereby reducing globin imbalance. In the absence of evidence for compensation via the remaining enhancers, an only mildly raised RBC (5.85 × 10¹² cells per liter) and a normal erythropoietin level (14 IU/L) at diagnosis, it seems most likely that the relatively mild clinical phenotype occurs because of selection of red cells with the least globin chain imbalance. Interestingly the α/β-globin mRNA ratio in the patient was more balanced in peripheral blood than in CD34+ culture-derived erythroid precursors (supplemental Figure 1B). Because there will be a normal distribution of the α/β globin ratios around the mean in any population of erythroid precursors, this selective process at the cellular level may play an important role in this remarkable clinical phenotype. Another contributing factor may be that the patient’s genotype is similar to that seen in individuals with AE Bart disease, in which a severe reduction in α-globin synthesis occurs in combination with the βE mutation. Although the patient has more severe thalassemia than previously described in these cases owing to her unique genotype, individuals with α-thalassemia who co-inherit β-thalassemia may have a milder phenotype than otherwise expected.12
In summary, these findings support the conclusion that the enhancer elements in the human α-globin locus contribute ∼10% (R1), 90% (R2), <2% to 3% (R3), and <2% to 3% (R4) to transcription compared with 40% (R1), 50% (R2), <2% to 3% (R3), and 10% (R4) in mouse.10 They also show that, although at some loci, compensation in gene expression may be mediated by enhancer redundancy, other pathophysiological mechanisms may compensate in whole organ/cell systems. Finally, these results show that when evaluating the effects of enhancers on gene expression, it is important to consider other influences on the ultimate cellular and organismal phenotype.
The genome sequencing data reported in this article have been deposited in the Gene Expression Omnibus database (accession numbers GSE149795 and GSE125926).
The online version of this article contains a data supplement.
Acknowledgments
This study was conducted in accordance with the Declaration of Helsinki.
This work was supported by grants from the Medical Research Council MR/P019633/1 (M.B.) and MR/R008108 (J.O.J.D.).
Authorship
Contribution: M.B., J.O.J.D., C.A.F., A.R., D.J.D., E.J.v.B., C.L.H., and A.B.G. performed experiments; M.B. analyzed data and made the figures; M.B. and D.R.H. wrote the paper; and D.R.H., C.L.H., E.J.v.B., and M.B. designed the research.
Conflict-of-interest disclosure: J.O.J.D. is a cofounder of Nucleome Therapeutics Ltd, to which he provides consultancy. The remaining authors declare no competing financial interests.
Correspondence: Douglas R. Higgs, MRC Weatherall Institute of Molecular Medicine, University of Oxford, John Radcliffe Hospital, Headington, Oxford OX3 9DS, UK; e-mail: liz.rose@imm.ox.ac.uk.

This feature is available to Subscribers Only
Sign In or Create an Account Close Modal