

Key Points
The Myc gene is a direct and essential target of EBF1 in early B-lymphocyte development in mice.
EBF1, PAX5, and MYC create a functional loop that controls normal pro–B-cell expansion in mice.

Abstract
Genes encoding B lineage–restricted transcription factors are frequently mutated in B-lymphoid leukemias, suggesting a close link between normal and malignant B-cell development. One of these transcription factors is early B-cell factor 1 (EBF1), a protein of critical importance for lineage specification and survival of B-lymphoid progenitors. Here, we report that impaired EBF1 function in mouse B-cell progenitors results in reduced expression of Myc. Ectopic expression of MYC partially rescued B-cell expansion in the absence of EBF1 both in vivo and in vitro. Using chromosome conformation analysis in combination with ATAC-sequencing, chromatin immunoprecipitation–sequencing, and reporter gene assays, six EBF1-responsive enhancer elements were identified within the Myc locus. CRISPR-Cas9–mediated targeting of EBF1-binding sites identified one element of key importance for Myc expression and pro-B cell expansion. These data provide evidence that Myc is a direct target of EBF1. Furthermore, chromatin immunoprecipitation–sequencing analysis revealed that several regulatory elements in the Myc locus are targets of PAX5. However, ectopic expression of PAX5 in EBF1-deficient cells inhibits the cell cycle and reduces Myc expression, suggesting that EBF1 and PAX5 act in an opposing manner to regulate Myc levels. This hypothesis is further substantiated by the finding that Pax5 inactivation reduces requirements for EBF1 in pro–B-cell expansion. The binding of EBF1 and PAX5 to regulatory elements in the human MYC gene in a B-cell acute lymphoblastic leukemia cell line indicates that the EBF1:PAX5:MYC regulatory loop is conserved and may control both normal and malignant B-cell development.
Introduction
The formation of lineage-restricted progenitor cells during hematopoiesis is under stringent control of transcription factor networks. This is well documented in B-lymphocyte development, where the coordinated action of factors, including TCF3 (transcription factor 3), IKZF1 (IKAROS family zinc finger-1), EBF1 (early B-cell factor 1), and PAX5 (paired box 5), control specification as well as lineage restriction.1 Although the developmental arrest observed in B-cell acute lymphoblastic leukemia (B-ALL) cells establishes a link between development and disease, the finding that several regulators of normal B-cell development are targeted by mutations in malignant cells2-5 suggests a direct role of transcription factor networks in transformation.6 These genetic alterations include inactivating mutations in the transcription factors IKZF1, EBF1, and PAX5,2-5 which are all independently critical for progression of normal B-cell development.6 Because these transcription factors are essential for normal differentiation, it has been suggested that their reduced functional activities contribute to the developmental arrest observed in B-ALL.3-5 Support for this idea comes from the finding that re-expression of PAX5 in a leukemia model is sufficient to release the developmental block of the transformed cells.7 However, leukemia developed more efficiently in mouse models in which one allele of Ebf1 or Pax5 was inactivated vs a complete developmental block introduced by homozygous mutation of Rag1 or Igµ.8
These observations suggest that EBF1 and PAX5 may have more complex roles in the transformation process, including control of DNA repair9 and metabolism.10 Although both PAX5 and IKZF1 act as repressors of metabolism in B-cell progenitors, it has been reported that EBF1 is critical for cell survival and proliferation in these cells.11-13 Inactivation of the Ebf1 gene in pro-B cells results in the rapid loss of progenitor cells in vivo that can only be overcome by malignant transformation or, to some extent, by ectopic expression of BCL2L1 or MYB.13 Together, these data suggest that EBF1 and PAX5 have distinct and possibly opposing functions in the regulation of cell survival and proliferation in normal B-cell development.
Here, we report that loss of functional EBF1 results in reduced expression of the Myc proto-oncogene (c-Myc) in B-cell progenitors. Our identification of 6 distinct EBF1-responsive regulatory elements annotated to the Myc gene either by proximity or proximity-ligated associated chromatin immunoprecipitation (ChIP) sequencing (PLAC-sequencing) analysis suggests that Myc is a direct target of EBF1 in developing B cells. Ectopic expression of PAX5 in the absence of functional EBF1 causes partial cell cycle arrest and reduced Myc expression, supporting the idea that pro–B-cell expansion depends on the opposing effects of EBF1 and PAX5 on the regulation of the Myc gene. Our identification of EBF1- and PAX5-binding regions in the human MYC locus defines a potential mechanism for how disruption of this regulatory loop may contribute to malignant conversion of B-cell progenitors to cause B-ALL.
Methods
Animal models
Ebf1−/−14 fetal liver (FL) cells were obtained from mice on the C57BL/6 (CD45.2) background while the bone marrow (BM) cells were generated from a mixed C57BL/6 129 mouse to avoid embryonal lethality.15 All transplantations were performed in SJL (CD45.1) female recipients. TetO-Cas9 mice were bought from JAX (stock no: 029476 - B6.Cg-Col1a1<tm1(tetO-cas9)Sho>/J) and crossed with R26m2rtTA mice16 to obtain a Cas9 inducible (iCas9) mouse line. Animal procedures were performed with consent from the local ethics committee at Linköping and/or Lund University (Sweden).
Cells and cell culture
BM B-cell precursors were generated by infection of primary Ebf1−/− BM progenitor cells with retroviruses (MIGR117 ) either GFP and a normal EBF1 protein or an EBF1 protein fused to a 4-hydroxytamoxifen (4-OHT) responsive ER ligand binding domain (EBF1-ER)18 as described in Ahsberg et al.19 FL pro-B progenitor cells were generated by sorting Lineage−SCA1+KIT+ cells from Ebf1−/− FLs followed by in vitrodifferentiation on OP9 stroma cells and subsequent transduction with EBF1 expression vectors. For EBF1 loss of function experiments, cells were grown in B-cell media with charcoal-treated serum (ThermoFisher Scientific, Waltham, MA) supplemented with 1 μM 4-OHT as indicated. Cell recovery was determined by fluorescence-activated cell sorting (FACS) by recording the number of CD45+CD19+ events in each well or when cells were grown in stroma-free conditions by live cell counting using a Biorad TC10 (Bio-Rad Laboratories, Hercules, CA). See supplemental Materials and methods for details (available on the Blood Web site).
Quantitative reverse transcription polymerase chain reaction
Quantitative reverse transcription polymerase chain reaction (PCR) analysis of sorted cells was performed as previously described.20 Assays-on-Demand probes (Applied Biosystems, Foster City, CA) used were: Hprt; Mm00446968_m1, Igll1; Mm01716144_m1, Pax 5; Mm00435501_m1, Myc; Mm00487803_ m1. The data was normalized to the level of Hprt.
Intracellular analysis of cell cycle status, phosphorylated Stat5 and PAX5 or MYC expression levels by FACS
To investigate the cell cycle status, flow cytometry was performed on fixed cells using Ki-67 and 4′,6-diamidino-2-phenylindole (DAPI). Prior to fixation, cells were stained with anti-CD19 antibody. Events with a sub-G0/G1 DNA content were gated out to exclude apoptotic cells from the cell cycle analysis. For analysis of MYC and PAX5 protein levels by intracellular staining, anti-MYC (9E10; R&D Systems, Minneapolis, MN) or anti-PAX5 (1H9; BioLegend, San Diego, CA) antibodies were added to the cells during Ki-67 staining. For investigation of phosphorylated Stat5, cells were stained with anti-CD45 (30-F11; BioLegend) and anti-CD19 followed by fixation and intracellular staining against anti-pY694 (47/Stat5; BD Biosciences, Franklin Lakes, NJ) or isotype control (MOPC-21; BD Biosciences). The analysis was performed on a BD LSRFortessa X20 flow cytome-ter (BD Biosciences). FlowJo software (BD Biosciences) was used for flow cytometry data analysis, and gates are based on fluorescence minus one controls or internal staining controls. See supplemental Materials and methods for details.
AnnexinV staining
To investigate cell death, cells were washed once in phosphate-buffered saline and once in binding buffer (556454; BD Biosciences) and thereafter stained with AnnexinV-APC (550475; BD Biosciences). Cells were resuspended in DAPI-containing binding buffer and analyzed by flow cytometry. AnnexinV and DAPI staining was investigated on FSC-A vs FSC-H singlet cell events where small events (fragments) as well large events (stromal cells) were excluded. The analysis was performed on a BD LSRFortessa X20 flow cytometer. See supplemental Materials and methods for details.
Transplantation
One million in vitro expanded cells were resuspended in 150 µL phosphate-buffered saline/1% fetal calf serum and transplanted by intravenous injection via the tail vein to 9-11-week-old preconditioned (2.25 Grey) CD45.1 mice. Three to four weeks after transplantation BM was collected as described in Somasundaram et al21 and analyzed for the presence of donor derived GFP+CD45.2+ or GFP+RFP+CD45.2+ cells by FACS. See supplemental Materials and methods for details.
ChIP-sequencing and data analysis of new and public data
Twenty million 230-238 cells were fixed at room temperature in 1 mg/ml di(N-succinimidyl) glutarate (ThermoFisher Scientific). DNA was extracted and sonicated as described in the supplemental Materials and methods. Ten μg per 107 cells of antibody rabbit anti-EBF1 polyclonal IgG (ABE1294; Millipore, Burlington, MA) was hybridized to 70 μl Protein-G Dynabeads (Life Technologies) and ChIP-seq was performed as described in the supplemental Materials and methods. 76 bp single read sequencing was performed on an Illumina NextSeq500 (San Diego, CA). The data are deposited in the Gene Expression Omnibus (GEO) database (GSE159957). For detailed information and a description of data analysis protocols of new as well as public data, see the supplemental Materials and methods.
PLAC-sequencing and data analysis
PLAC-seq was carried out similar to that previously reported22 with minor modifications (see supplemental Materials and methods for details) using an antibody targeting H3K4me3 (07-473; Millipore). PLAC-seq libraries were subject to 2× 75 cycles of paired-end sequencing on a NextSeq500. The data is deposited to the GEO database (GSE159957). FL Wt pro-B and FL Ebf1−/− pro-B H3K4me3 PLAC-seq experiments were carried out in triplicate and quadruplicate, respectively. For information about the data analysis protocol, see supplemental Materials and methods.
Identification of EBF1 and PAX5 targeted Myc cis-regulatory elements
Visual inspection of the virtual 4C genome browser tracks revealed two regions with an increased interaction frequency with the Myc transcriptional start site. These regions were filtered for binding of EBF1 in 230-238 B-cells (this article) and PAX5 (GEO: GSE12637522 ) and ATAC accessibility identifying 6 regions selected for further investigation by luciferase reporter assays, EMSA, and Cas9-mediated targeting (for detailed information see supplemental Materials and methods).
CRISPR/Cas9 mediated knock-out of Pax5 in pro-B cells
MSCV-Cas9-GFP–mediated gene inactivation was performed similar to that previously reported,23 with the difference that a modified version of the pSuper vector was used for cloning of protospacer sequences. MSCV-Cas9-GFP and pSuper retroviral supernatants were produced in platinum-E cells. Supernatants were collected 48 h posttransfection and 500 μl was used to transduce EBF1-ER and Ebf1-expressing pro-B cells by spin infection.21 Puro resistance Cas9 expressing cells were generated by 4 days of selection in puromycin (Sigma-Aldrich, St. Louis, MI) followed by secondary infection with Pax5 guides. After 4 days CD19− cells were sorted and expanded. For a detailed description, see supplemental Materials and methods.
RNA-sequencing and data analysis
Total RNA was isolated using RNAeasy Micro Kit (Qiagen, Hilden, Germany) according to the manufacturer’s recommendations. Libraries were constructed using NuGEN’s Ovation Ultralow Library systems (NuGEN Technologies, San Carlos, CA) and were subsequently subjected to 76 cycles of NextSeq500 sequencing. For analysis of RNA-Seq experiments the reads were aligned to mouse reference genome (mm10/GRCm38) using STAR (2.6.0b-1)24 for subsequence processing. Gene set enrichment analysis was performed using GSEA software (v. 4.0.1; UC San Diego, San Diego, CA). For detailed information about RNA-seq and data analysis, see supplemental Materials and methods.
Results
EBF1 is essential for normal cell expansion in early progenitor cells
To explore the molecular mechanism by which EBF1 regulates cell survival and proliferation, we used a model system based on a 4-OHT–responsive EBF1 protein (EBF1-ER)18 expressed in B-cell progenitors from Ebf1−/− mice.14 This system allows us to dynamically control the function of EBF1 by regulating its nuclear accessibility.18 Infection of BM cells from neonatal mice or FL progenitor cells with retroviruses encoding either a conventional EBF1 or 4-OHT–responsive EBF1-ER protein allowed for the formation of CD19+ pro-B cells on OP9 stroma cells in the presence of 4-OHT (Figure 1A). Withdrawal of 4-OHT for 72 hours did not result in any significant reduction in live cell recovery of cells rescued by expression of conventional EBF1 (supplemental Figure 1A). However, CD19+ cells generated by expression of EBF1-ER rapidly responded to removal of 4-OHT by reduced growth and loss of live cells (Figure 1B; supplemental Figure 1B). To explore the viability of the cells remaining after 72 hours, we re-plated 10 or 50 live cells on OP9 stroma cells in the presence of 4-OHT. This revealed significantly reduced cloning frequencies of cells preincubated in the absence of 4-OHT. Thus, live cells remaining after EBF1 depletion display an irreversible defect in cellular expansion (supplemental Figure 1C). Determination of the cell cycle status of EBF1-ER–transduced cells 48 hours after removal of 4-OHT revealed an increased portion of cells in the G0 stage and a relative reduction of cells in the G1, S, G2, and M phases in the absence of 4-OHT compared with the presence of 4-OHT (Figure 1C). Hence, depletion of nuclear EBF1 results in a partial cell cycle arrest, with the majority of cells exiting the cell cycle to reside in G0.
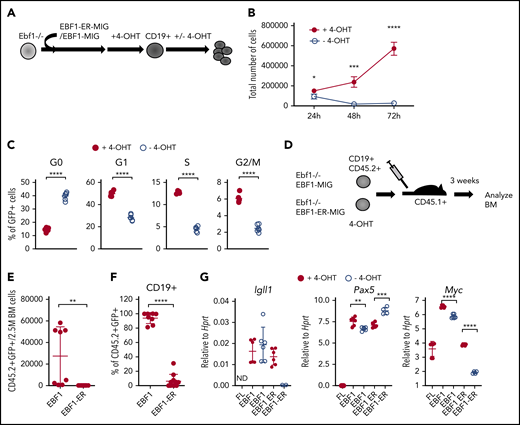
Loss of functional EBF1 results in reduced levels of Myc transcripts and cell cycle arrest in pro-B cells. (A) Schematic drawing of the basic experimental layout. Neonatal Ebf1−/− BM or Ebf1−/− FL were transduced with EBF1-MIG (EBF1) or an EBF1-estrogen receptor fusion protein (EBF1-ER) construct. Cells were then exposed to 4-OHT to allow nuclear translocation of EBF1 in Ebf1-deficient cells carrying the EBF1-ER construct, which drives development into the CD19+ stage. 4-OHT was then withdrawn to test the dependency of EBF1 in the generated CD19+ cells. (B) Number of live cells of cultured EBF1 or EBF1-ER transduced and 4-OHT–treated Ebf1−/− BM cell cultures (as in panel A). Cells were either incubated continuously with 4-OHT (+4-OHT) or with 4-OHT withdrawn (-4-OHT) for 48 to 72 hours as indicated. Mean and standard deviation (SD) are shown; n = 4, from 4 culture experiments. (C) Cell cycle distributions of the cells in panel B at 48 hours after 4-OHT withdrawal. Mean and standard error of the mean are shown, n = 6). (D) The experimental protocol used to test the cell autonomous role of EBF1 in pro–B cell survival in vivo. Ebf1−/− FL cells were transduced to express EBF1 or EBF1-ER and treated with 4-OHT for 14 days. At day 15, a total of 1 million green fluorescent protein (GFP)+CD19+ cells were transplanted into C57BSJL (CD45.1) sublethally irradiated recipients. Donor reconstitution (CD45.2+GFP+), as well as CD19 expression, was determined by FACS 3 weeks posttransplantation. (E-F) Relative cell counts, from the BM of mice transplanted with either EBF1- or EBF1-ER–transduced cells. Mean and SD are shown; EBF1 n = 8, EBF1-ER n = 11, from 2 independent experiments. (G) Diagrams with quantitative reverse transcription PCR data from in vitro expanded Ebf1−/− FL pro-B control cells (FL) or BM cells from EBF1-deficient mice driven to B-cell progenitor stages with conventional or ER-fused EBF1 protein cultured in the presence or absence of 4-OHT for 72 hours. Mean and SD are shown; n = 4 to 7, from 2 independent experiments. For panels C and E-G, each dot indicates a data point, and the statistical analysis is based on a Student unpaired t test. *P < .05; **P < .01; ***P < .001; ****P < .0001.
Loss of functional EBF1 results in reduced levels of Myc transcripts and cell cycle arrest in pro-B cells. (A) Schematic drawing of the basic experimental layout. Neonatal Ebf1−/− BM or Ebf1−/− FL were transduced with EBF1-MIG (EBF1) or an EBF1-estrogen receptor fusion protein (EBF1-ER) construct. Cells were then exposed to 4-OHT to allow nuclear translocation of EBF1 in Ebf1-deficient cells carrying the EBF1-ER construct, which drives development into the CD19+ stage. 4-OHT was then withdrawn to test the dependency of EBF1 in the generated CD19+ cells. (B) Number of live cells of cultured EBF1 or EBF1-ER transduced and 4-OHT–treated Ebf1−/− BM cell cultures (as in panel A). Cells were either incubated continuously with 4-OHT (+4-OHT) or with 4-OHT withdrawn (-4-OHT) for 48 to 72 hours as indicated. Mean and standard deviation (SD) are shown; n = 4, from 4 culture experiments. (C) Cell cycle distributions of the cells in panel B at 48 hours after 4-OHT withdrawal. Mean and standard error of the mean are shown, n = 6). (D) The experimental protocol used to test the cell autonomous role of EBF1 in pro–B cell survival in vivo. Ebf1−/− FL cells were transduced to express EBF1 or EBF1-ER and treated with 4-OHT for 14 days. At day 15, a total of 1 million green fluorescent protein (GFP)+CD19+ cells were transplanted into C57BSJL (CD45.1) sublethally irradiated recipients. Donor reconstitution (CD45.2+GFP+), as well as CD19 expression, was determined by FACS 3 weeks posttransplantation. (E-F) Relative cell counts, from the BM of mice transplanted with either EBF1- or EBF1-ER–transduced cells. Mean and SD are shown; EBF1 n = 8, EBF1-ER n = 11, from 2 independent experiments. (G) Diagrams with quantitative reverse transcription PCR data from in vitro expanded Ebf1−/− FL pro-B control cells (FL) or BM cells from EBF1-deficient mice driven to B-cell progenitor stages with conventional or ER-fused EBF1 protein cultured in the presence or absence of 4-OHT for 72 hours. Mean and SD are shown; n = 4 to 7, from 2 independent experiments. For panels C and E-G, each dot indicates a data point, and the statistical analysis is based on a Student unpaired t test. *P < .05; **P < .01; ***P < .001; ****P < .0001.
The role of EBF1 in pro–B-cell expansion was further investigated by transplantation of CD19+CD45.2+Ebf1−/− cells, rescued by expression of either conventional EBF1 or ER-fused EBF1 by cultivation in 4-OHT, into congenic mice (Figure 1D). CD19+CD45.2+ cells expressing conventional EBF1 were detected 3 weeks after transplantation; however, few CD45.2 cells were found in the BM of mice transplanted with CD19+ cells rescued in vitro by expression of the EBF1-ER protein (Figure 1E-F). These data support the idea that EBF1 is essential for normal pro–B-cell expansion.11-13
To resolve the molecular mechanisms underlying the role of EBF1 in pro–/pre–B-cell expansion, we used RNA-sequencing to identify genes with altered expression patterns 72 hours after 4-OHT removal from Ebf1−/− EBF1-ER–rescued cells. EBF1-expressing cells cultivated either in the presence or absence of 4-OHT were used as a control to identify and exclude drug-induced changes in gene expression patterns (supplemental Data Sheets 1 and 2; supplemental Figure 1D). Although messenger RNA levels from EBF1 target genes such as Igll1, Vpreb3, and Vpreb2 were reduced upon loss of nuclear EBF1, Pax5 expression was modestly altered (Figure 1G). We did not detect dramatically reduced levels of the proposed EBF1 targets Myb (1.2-fold downregulated) or Bcl2l1 (1.2-fold upregulated).13 Furthermore, we were unable to detect any significant reduction in the levels of phosphorylated STAT5 in the EBF1-ER–transduced cells upon removal of 4-OHT (supplemental Figure 1E-F). Hence, no support was found that the short-term loss of nuclear EBF1 results in collapse of the lineage-specific transcriptional program or dysfunctional interleukin-7 signaling. In contrast, significantly reduced expression of Myc was detected by RNA-sequencing as well as by quantitative reverse transcription PCR.
MYC is reportedly essential for normal B-cell development,25,26 and Myc-expressing tumors have been reported to tolerate loss of EBF1 expression.27 These observations indicate the existence of a functional interplay between EBF1 and MYC. To investigate a potential functional interaction between MYC and EBF1, we transduced EBF1- or EBF1-ER–rescued Ebf1−/− CD19+ BM pro-B cells with a bicistronic MYC–red fluorescent protein (RFP) encoding retroviruses. Enforced expression of MYC had a minor impact on cell recovery in control (MIG), EBF1, or EBF1-ER virus-transduced Ebf1−/− cells in the presence of 4-OHT (Figure 2A-C). However, although Ebf1−/− EBF1-ER cells transduced with the control RFP virus expanded poorly after 4-OHT removal, Ebf1−/− EBF1-ER pro-B cells transduced with the MYC encoding virus did not display the same dependency on nuclear EBF1 (Figure 2C). Furthermore, ectopic expression of MYC was sufficient for pro–B cell recovery in the absence of nuclear EBF1 after transplantation of EBF1-ER–rescued CD19+ cells (Figure 1A) into congenic mice in the absence of 4-OHT treatment (Figure 2D). However, although ectopic expression of MYC allowed for the expansion of CD19+ cells in vivo, we did not detect generation of immunoglobulin M–positive cells in the transplanted mice (Figure 2E). The removal of 4-OHT for 48 hours increased frequencies of apoptotic cells selectively in the EBF1-ER–expressing cells, an effect that could not be rescued by ectopic MYC expression (Figure 2F). Hence, ectopic expression of MYC reduced requirements for EBF1 in pro–B-cell expansion, but no evidence was found that MYC can prevent apoptosis or substitute for EBF1 in B-lineage differentiation.
![Ectopic expression of MYC rescues pro–B cell expansion in the absence of EBF1. Cell recovery from cultures of FL Ebf1−/− cells in vitro cultivated as described in Figure 1A. Cells were transduced with an empty MIG-GFP (MIGR1) vector (A), an EBF1-GFP vector (EBF1) (B), or an ER-fused EBF1 protein (EBF1-ER) (C) and serially transduced with an RFP control or a MYC-expressing RFP retrovirus. The diagrams display cell recovery when the cells were grown in the presence or absence of 4-OHT for 72 hours. Mean and standard deviation are shown; n = 6 to 12, from 3 independent experiments. (D) Recovery of CD45.2+CD19+GFP+RFP+ BM cells 3 to 4 weeks after transplantation of Ebf1−/− FL pro-B cells transduced with EBF1-ER and either a control RFP or MYC-expressing RFP-encoding retrovirus into sublethally irradiated CD45.1 mice. Mean and standard deviation are shown; n = 4 to 6 transplanted mice. (E) Representative FACS plot of immunoglobulin M (IgM) and CD19 expression on recipient (CD45.1) and donor (CD45.2+GFP+RFP+) cells. (F) Fraction of early (Annexin V–positive/4′6-diamidino-2-phenylindole–negative [red bar]) and late (Annexin V–positive/4′6-diamidino-2-phenylindole–positive [blue bar]) apoptotic cells 48 hours after removal of 4-OHT in EBF1- and EBF1-ER–expressing Ebf1−/− BM cells transduced with either RFP-control or RFP-Myc virus. Mean and standard error of the mean are shown; n = 3. The statistical analysis is based on comparisons of data from cells grown in the presence or absence of 4-OHT. (G) Histograms displaying overlays of an FACS staining of MYC protein in different stages of the cell cycle. (H) Bars depicting the ratios of MYC median fluorescent intensity (MFI) of each stage of the cell cycle compared with G0 48 hours after 4-OHT withdrawal in Wt and Ebf1−/−EBF1-ER BM cells Mean and standard error of the mean are shown, n = 6. The statistical analysis is based on a Student unpaired t test. *P < .05; **P < .01; ***P < .001; ****P < .0001. ns, not significant.](https://ash.silverchair-cdn.com/ash/content_public/journal/blood/137/22/10.1182_blood.2020009564/1/m_bloodbld2020009564f2.png?Expires=1767699570&Signature=SVvl-rjVxgZU16qpjgsZt5zIetaSNQGyn4ZCi1DIX-Uv84POtxlMcZ7WqOtmVRfiNRR1JKInAJPRdAkndksG8BNSptY2iu6u-JvfRe5E92cw6qMspReeYbSY-XuGcZ2IZRRFlQzX1gQaPMe89BmS2sFFjjkwkXk5Ok7xVlWd4i~PVPKviadtQq-1V5mfxgi4O38m~LJTVGjUxU8KUVN~GoYWIHeiGQky8DHPgKeIoEEx78fcO6S9y43DkiVgVjiEa9U2HsWBui5yuMBDChu~2kn7DvKUQpxcKuE6i~gL35iNwp6i4M8AgAsBV8CsOOlQK9MJAa341YEBxB5sex9cwQ__&Key-Pair-Id=APKAIE5G5CRDK6RD3PGA)
Ectopic expression of MYC rescues pro–B cell expansion in the absence of EBF1. Cell recovery from cultures of FL Ebf1−/− cells in vitro cultivated as described in Figure 1A. Cells were transduced with an empty MIG-GFP (MIGR1) vector (A), an EBF1-GFP vector (EBF1) (B), or an ER-fused EBF1 protein (EBF1-ER) (C) and serially transduced with an RFP control or a MYC-expressing RFP retrovirus. The diagrams display cell recovery when the cells were grown in the presence or absence of 4-OHT for 72 hours. Mean and standard deviation are shown; n = 6 to 12, from 3 independent experiments. (D) Recovery of CD45.2+CD19+GFP+RFP+ BM cells 3 to 4 weeks after transplantation of Ebf1−/− FL pro-B cells transduced with EBF1-ER and either a control RFP or MYC-expressing RFP-encoding retrovirus into sublethally irradiated CD45.1 mice. Mean and standard deviation are shown; n = 4 to 6 transplanted mice. (E) Representative FACS plot of immunoglobulin M (IgM) and CD19 expression on recipient (CD45.1) and donor (CD45.2+GFP+RFP+) cells. (F) Fraction of early (Annexin V–positive/4′6-diamidino-2-phenylindole–negative [red bar]) and late (Annexin V–positive/4′6-diamidino-2-phenylindole–positive [blue bar]) apoptotic cells 48 hours after removal of 4-OHT in EBF1- and EBF1-ER–expressing Ebf1−/− BM cells transduced with either RFP-control or RFP-Myc virus. Mean and standard error of the mean are shown; n = 3. The statistical analysis is based on comparisons of data from cells grown in the presence or absence of 4-OHT. (G) Histograms displaying overlays of an FACS staining of MYC protein in different stages of the cell cycle. (H) Bars depicting the ratios of MYC median fluorescent intensity (MFI) of each stage of the cell cycle compared with G0 48 hours after 4-OHT withdrawal in Wt and Ebf1−/−EBF1-ER BM cells Mean and standard error of the mean are shown, n = 6. The statistical analysis is based on a Student unpaired t test. *P < .05; **P < .01; ***P < .001; ****P < .0001. ns, not significant.
Ectopic expression of MYC rescues pro–B cell expansion in the absence of EBF1. Cell recovery from cultures of FL Ebf1−/− cells in vitro cultivated as described in Figure 1A. Cells were transduced with an empty MIG-GFP (MIGR1) vector (A), an EBF1-GFP vector (EBF1) (B), or an ER-fused EBF1 protein (EBF1-ER) (C) and serially transduced with an RFP control or a MYC-expressing RFP retrovirus. The diagrams display cell recovery when the cells were grown in the presence or absence of 4-OHT for 72 hours. Mean and standard deviation are shown; n = 6 to 12, from 3 independent experiments. (D) Recovery of CD45.2+CD19+GFP+RFP+ BM cells 3 to 4 weeks after transplantation of Ebf1−/− FL pro-B cells transduced with EBF1-ER and either a control RFP or MYC-expressing RFP-encoding retrovirus into sublethally irradiated CD45.1 mice. Mean and standard deviation are shown; n = 4 to 6 transplanted mice. (E) Representative FACS plot of immunoglobulin M (IgM) and CD19 expression on recipient (CD45.1) and donor (CD45.2+GFP+RFP+) cells. (F) Fraction of early (Annexin V–positive/4′6-diamidino-2-phenylindole–negative [red bar]) and late (Annexin V–positive/4′6-diamidino-2-phenylindole–positive [blue bar]) apoptotic cells 48 hours after removal of 4-OHT in EBF1- and EBF1-ER–expressing Ebf1−/− BM cells transduced with either RFP-control or RFP-Myc virus. Mean and standard error of the mean are shown; n = 3. The statistical analysis is based on comparisons of data from cells grown in the presence or absence of 4-OHT. (G) Histograms displaying overlays of an FACS staining of MYC protein in different stages of the cell cycle. (H) Bars depicting the ratios of MYC median fluorescent intensity (MFI) of each stage of the cell cycle compared with G0 48 hours after 4-OHT withdrawal in Wt and Ebf1−/−EBF1-ER BM cells Mean and standard error of the mean are shown, n = 6. The statistical analysis is based on a Student unpaired t test. *P < .05; **P < .01; ***P < .001; ****P < .0001. ns, not significant.
Because MYC has been suggested to be differentially expressed during the cell cycle,28 we used FACS to determine MYC protein levels in G0-, G1-, S-, and G2/M-phase pro-B cells. Similar to previous observations, MYC protein levels increased progressively from low levels in G0 cells to the highest levels in G2/M-phase cells in control pro-B cells as well as in the Ebf1−/− cells expressing the EBF1-ER protein (Figure 2G). The functional inactivation of EBF1 by removal of 4-OHT resulted in an increase in the MYClow G0 fraction relative to the cells cultivated in the presence of 4-OHT. Furthermore, determination of the ratio of MYC protein levels in G0 cells, compared with those observed in active stages of the cell cycle, revealed that the EBF1-ER–expressing G0 cells expressed relatively lower levels of MYC compared with actively cycling cells in the absence of 4-OHT (Figure 2H). Although these data verify that MYC levels are reduced upon inactivation of EBF1, the complex relation between MYC levels and cell cycle progression calls for additional analysis to resolve if Myc is a direct target for EBF1 in pro-B cells.
The Myc gene is a direct target of EBF1 in pro-B cells
The regulation of the Myc gene is highly complex and involves regulatory elements located as far as 1.7 MBp from the coding sequences.29 Hence, a direct screening of the promoter or proximity annotated distal elements for EBF1-binding sites would not provide an exhaustive identification of EBF1 sites that participate in the regulation of Myc. To identify distal regions that interact with the Myc promoter in pro-B cells, we generated H3K4me3 ChIP/PLAC-sequencing data from Wt and Ebf1−/− pro-B cells and conducted a virtual 4C analysis with the Myc-promoter as the viewpoint (Figure 3A). This revealed that the major part of the distal interacting elements, including the blood enhancer cluster (BENC) superenhancer region, was located 3′ of the Myc gene. Combining PLAC-sequencing data with ATAC-sequencing data generated using Wt or Ebf1−/− pro-B cells22,30 and analyzing these together with EBF1/ChIP-sequencing data from 230-238 progenitor B cells, multiple EBF1-binding elements were identified in the Myc locus. Correlations between the datasets allowed for the identification of one region 5′ of the Myc gene (5′E) as well as 5 putative EBF1-targeted regulatory elements 3′ of the coding gene (Figure 3A-B). One of these (E1) was located just over 700 kbp from the coding gene, whereas the remaining 4 elements (E2-E5) were located between 1.6 and 1.7 Mbp from the transcriptional start site within the region defined as harboring the BENC superenhancer.29 Although E4 to E5 displayed accessibility (as determined by ATAC-sequencing analysis) in both Wt and Ebf1−/− cells, E1 to E3 accessibility was limited in EBF1-deficient cells, indicating that the epigenetic state of these elements depends on EBF1 (Figure 3B). Reanalysis of ChIP- and CUT&RUN-sequencing data from FL pro-B cells (GSE162858) revealed enrichment of acetylated histone H3 lysine K27 (H3K27ac) at the EBF1-bound regions, indicating that they represent active elements. Furthermore, these regions were enriched for demethylated H3 lysin 4 (H3K4me2), whereas the levels of the promoter-associated trimethylated histone H3 lysin 4 (H3K4me3) were low. These data support the conclusion that elements bound by EBF1 in the Myc locus are active enhancers in pro-B cells.
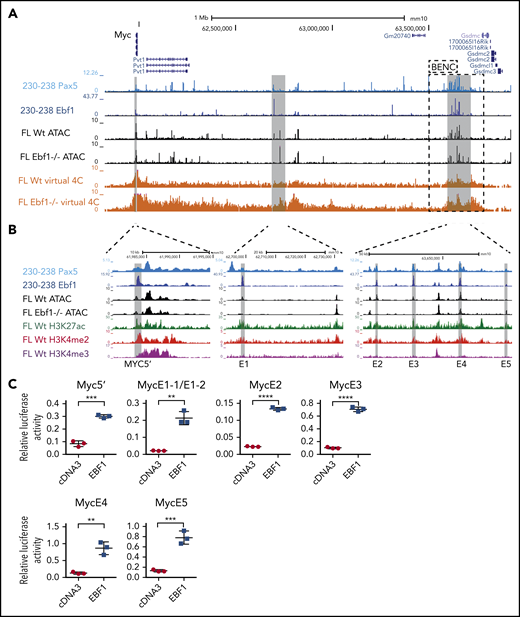
The mouse Myc gene contains multiple EBF1-responsive enhancer elements. (A) UCSC Genome Browser view of the murine Myc locus and its distal interacting regions. The tracks display PAX5 (GSE126375) and EBF1 binding in 230-238 progenitor B cells, ATAC-accessibility (GSE92434), as well as a PLAC-sequencing derived virtual 4C tracks from Wt and Ebf1−/− FL-derived pro-B cells. Myc transcriptional start site ±2.5 kb was used as the viewpoint for the virtual 4C analysis. The previously defined BENC enhancer region29 is indicated by a dashed square. (B) Zoomed-in view of 3 specific regions in panel A with high PAX5 and EBF1 binding as well as ATAC accessibility in Wt pro-B cells and interaction with the Myc promoter. These regions were examined for the presence of histone modifications by reanalysis of ChIP- and CUT&RUN-sequencing data (GSE162858). The gray lines indicate the regions that are targeted for luciferase reporter activity assays. (C) Relative Firefly/Renilla (Prl0) luciferase activity obtained from reporter constructs in which the EBF1-binding regions described in panel B were cloned upstream of a basal Fos promoter in the absence (empty cDNA3) or presence of EBF1 in HeLa cells. Each dot represents one transfection, and the statistical analysis is based on a Student unpaired t test. **P < .01; ***P < .001; ****P < .0001.
The mouse Myc gene contains multiple EBF1-responsive enhancer elements. (A) UCSC Genome Browser view of the murine Myc locus and its distal interacting regions. The tracks display PAX5 (GSE126375) and EBF1 binding in 230-238 progenitor B cells, ATAC-accessibility (GSE92434), as well as a PLAC-sequencing derived virtual 4C tracks from Wt and Ebf1−/− FL-derived pro-B cells. Myc transcriptional start site ±2.5 kb was used as the viewpoint for the virtual 4C analysis. The previously defined BENC enhancer region29 is indicated by a dashed square. (B) Zoomed-in view of 3 specific regions in panel A with high PAX5 and EBF1 binding as well as ATAC accessibility in Wt pro-B cells and interaction with the Myc promoter. These regions were examined for the presence of histone modifications by reanalysis of ChIP- and CUT&RUN-sequencing data (GSE162858). The gray lines indicate the regions that are targeted for luciferase reporter activity assays. (C) Relative Firefly/Renilla (Prl0) luciferase activity obtained from reporter constructs in which the EBF1-binding regions described in panel B were cloned upstream of a basal Fos promoter in the absence (empty cDNA3) or presence of EBF1 in HeLa cells. Each dot represents one transfection, and the statistical analysis is based on a Student unpaired t test. **P < .01; ***P < .001; ****P < .0001.
To investigate if these elements act as EBF1-responsive enhancers, we cloned the identified regions into a luciferase reporter vector upstream of a basal Fos promoter. The reporter constructs were transfected into HeLa cells, lacking expression of endogenous EBF1, together with empty or EBF1-encoding cDNA3 vectors (Figure 3C). Each of the elements responded to the expression of EBF1 by fourfold to sevenfold increases in luciferase activity compared with the 1.6-fold upregulation observed for the basal Fos promoter (supplemental Figure 2A). These data confirm that the Myc locus harbors EBF1-responsive regulatory elements.
To investigate whether EBF1-binding sites in these elements are functionally important for normal growth and expansion of pro-B cells, we inspected the DNA sequences to identify putative binding sites in all the identified EBF1-responsive enhancers (Figure 4A). To investigate the ability of these sites to interact with EBF1, electrophoretic mobility shift assays (Figure 4B) were performed. Binding of in vitro translated EBF1 to 32P-labeled duplex oligonucleotide from the Cd79a promoter (supplemental Figure 2B) was competed by excess unlabeled putative binding sites from the EBF1-responsive Myc enhancers. Binding to the Cd79a promoter EBF1 site was efficiently competed by putative binding regions in the Myc enhancers, confirming the presence of EBF1-binding sites in the Myc locus.
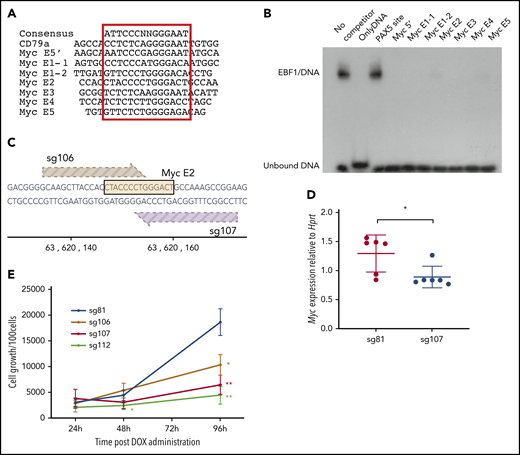
EBF1 directly targets an essential binding site in the BENC enhancer region. (A) The sequence of known EBF1-binding sites and 6 predicted EBF1-binding sites within 5 putative Myc 3′enhancer elements as well as a potential EBF1-binding site in the 5′ region of Myc. The core binding site is indicated by a red box. (B) Autoradiogram displaying the result of an electrophoretic mobility shift assay experiment in which the binding of in vitro translated EBF1 to a radioactive labeled Cd79a promoter-EBF1 site is competed for by the addition of a 200-fold excess of nonlabeled putative EBF1-binding sites in Myc enhancers or the PAX5-binding site from the Cd19 promoter. The autoradiogram is representative of 2 independent experiments. (C) Schematic drawing of the targeting of CRISPR guides 106 and 107 to the EBF1-binding site in Myc E2. The DNA sequence of the EBF1 binding motif is depicted in yellow, and guides 106 (light brown) and 107 (dark brown) are shown pointing toward a 3′ NGG PAM sequence. The scale indicates the genomic location on mouse chromosome 15. (D) Myc quantitative reverse transcription PCR data from CD19+ iCas9 BM cells transduced with CRISPR guide 81 (control) or 107 (Myc E2) and subsequently treated with doxycycline (DOX) for 48 hours. Mean and standard deviation are shown; n = 6, from 3 individual samples from different mice. (E) Proliferation per 100 iCas9 CD19+ BM cells at 24, 48, and 96 hours after DOX administration in samples infected with gRNA constructs sg106 and 107 (targeting EBF1-binding site Myc E2), sg81 (targeting an EBF1 site linked to the Gfra2 gene), or sg112 (targeting the coding region of Myc). Mean and standard deviation are shown. *P < .05; **P < .01, Student t test compared with sg81), from 3 independent samples from different mice.
EBF1 directly targets an essential binding site in the BENC enhancer region. (A) The sequence of known EBF1-binding sites and 6 predicted EBF1-binding sites within 5 putative Myc 3′enhancer elements as well as a potential EBF1-binding site in the 5′ region of Myc. The core binding site is indicated by a red box. (B) Autoradiogram displaying the result of an electrophoretic mobility shift assay experiment in which the binding of in vitro translated EBF1 to a radioactive labeled Cd79a promoter-EBF1 site is competed for by the addition of a 200-fold excess of nonlabeled putative EBF1-binding sites in Myc enhancers or the PAX5-binding site from the Cd19 promoter. The autoradiogram is representative of 2 independent experiments. (C) Schematic drawing of the targeting of CRISPR guides 106 and 107 to the EBF1-binding site in Myc E2. The DNA sequence of the EBF1 binding motif is depicted in yellow, and guides 106 (light brown) and 107 (dark brown) are shown pointing toward a 3′ NGG PAM sequence. The scale indicates the genomic location on mouse chromosome 15. (D) Myc quantitative reverse transcription PCR data from CD19+ iCas9 BM cells transduced with CRISPR guide 81 (control) or 107 (Myc E2) and subsequently treated with doxycycline (DOX) for 48 hours. Mean and standard deviation are shown; n = 6, from 3 individual samples from different mice. (E) Proliferation per 100 iCas9 CD19+ BM cells at 24, 48, and 96 hours after DOX administration in samples infected with gRNA constructs sg106 and 107 (targeting EBF1-binding site Myc E2), sg81 (targeting an EBF1 site linked to the Gfra2 gene), or sg112 (targeting the coding region of Myc). Mean and standard deviation are shown. *P < .05; **P < .01, Student t test compared with sg81), from 3 independent samples from different mice.
Having identified EBF1-binding sites, we sought to confirm their function in pro-B cells. We therefore took advantage of a mouse model in which the expression of Cas9 is under the regulation of a tetracycline (doxycycline)-responsive promoter. These mice were crossed to animals carrying a doxycycline-dependent transcriptional activator under the control of the broadly active ROSA26 locus. We then designed guide RNAs (gRNAs) targeting several of the EBF1-binding sites as well as the Myc coding region. As an additional control, an EBF1-binding site annotated to the Gfra2 gene was targeted, shown redundant for B-cell development.30 The gRNAs were cloned into lentiviral vector backbones expressing a red fluorescent marker protein (mCherry). KIT+ primary BM cells were transduced with the gRNA virus constructs, sorted for expression of mCherry, and differentiated in vitro into pro-B cells. Before the addition of doxycycline, samples of cells were extracted to determine the distribution of gRNAs in the input populations by PCR amplification of viral inserts in genomic DNA (Library 1). After Cas9 induction, the cells were grown for 6 days, the remaining progenitors were collected, and the distribution of integrated gRNAs in the genomic DNA of the remaining cells was determined (Library 2). High-throughput sequencing of the PCR products allowed us to compare the ratio of guides in the input (Library 1) compared with the cells present 6 days after induction of Cas9 expression (Library 2). This revealed a reduced representation of guides 106 and 107, both targeting the same EBF1-binding site in E2 (supplemental Figure 2C; Figure 4C). We also detected a reduced representation of guides targeting the coding region of the Myc gene (111 and 112). A modest increase was noted in the relative presence of several guides, likely as a reflection of the reduced relative presence of guides 106, 107, 111, and 112. To explore the editing efficiency of our gRNAs, we amplified the targeted regions in the total population by genomic PCR, sequenced the obtained products, and determined mutation rates. Comparing the mutation rates of the target regions vs the relative presence of inserted gRNAs suggested efficient editing by all the investigated guides (supplemental Figure 2D), indicating that only the EBF1 site in E2 is nonredundant for normal pro-B cell expansion.
To verify the role of the E2 site, we transduced progenitor cells with gRNA 106 (E2) and 107 (E2) (Figure 4C), as well as gRNA 112, targeting the Myc gene, and gRNA 81, targeting a putative EBF1-binding site in the Gfra2 locus. Two days after induction of Cas9 transcription by the addition of doxycycline, Myc messenger RNA levels were reduced in the cells transduced with the guides targeting the E2-EBF1 site (sg107 [Figure 4D] or sg106 [supplemental Figure 2E]) compared with those expressing sg81. After the expansion of B-cell progenitors in vitro from 24 to 96 hours after the induction of Cas9 expression, we noted the reduced expansion of cells transduced with either guide 106, 107, or 112 compared with those transduced with the Gfra2 locus targeting guide 81 (Figure 2E). To determine the targeting efficiency, we extracted DNA from cells harvested 96 hours after CAS9 induction, amplified the targeted region by PCR, and sequenced the obtained products. All 4 guides facilitated mutations in >70% of the PCR products generated from the target sequences (supplemental Figure 2F). Even though mutations could be detected in an area spanning 70 bp, the most commonly detected indels, representing 41% (sg106) and 46% (sg107) of the reads with mutations, involved 5 to 7 bp targeting the EBF1 core binding site (supplemental Figure 2G). Performing a motif analysis of the targeted area identified the EBF1-binding site as well as a cryptic E-box, potentially capable of interacting with TCF3 or TCF12, and a binding site for TBX1. Because the E-box and the TBX1 site were located 3′ of the EBF1 core site, these were preferentially targeted by sg106. These data show that mutations in the EBF1 binding region of E2 reduce the expression of Myc and pro-B cell expansion. Although the involvement of other factors should not be excluded, these data support the idea that Myc is a direct target for EBF1.
EBF1 and PAX5 have opposing roles in the regulation of the Myc gene
Next, we wanted to understand the mechanisms by which a progenitor cell develops dependency on EBF1. To this end, we exposed Ebf1−/−EBF1-ER FL cells to 4-OHT for 4 or 7 days. This relatively short exposure resulted in a mixture of CD19+ and CD19– cells in the cultures. Exposure to 4-OHT for 4 days impaired the ability of CD19–, and abolished the potential of CD19+ progenitor cells, to expand in the absence of 4-OHT in secondary cultures (Figure 5A). This outcome suggests the rapid development of EBF1 dependency in early B-cell progenitors.

PAX5 acts as a negative regulator of cell proliferation and MYC function in pro-B cells. (A) Cell recovery 3 days after seeding of 2000 sorted GFP+CD45+ in vitro expanded FL cells from Ebf1−/− mice exposed to nuclear EBF1 by cultivation in 4-OHT for 4 or 7 days before sorting and reseeding in cultures in the absence of 4-OHT. Mean and standard deviation (SD) are shown; n = 5 to 6, from 2 independent experiments. Total cell recovery (B) and the fraction of CD19+ cells (C) recovered 4 days after seeding 2000 GFP+Ebf1−/− FL cells transduced with either MIG-control, EBF1, or PAX5 encoding virus. Mean and SD are shown; n = 7, from 2 independent experiments. (D) Cell cycle data from Ebf1−/− FL cells transduced with MIG-control, EBF1, or PAX5 encoding virus as determined by FACS analysis. Mean and standard error of the mean are shown; n = 3. (E) Quantitative reverse transcription PCR analysis determining the levels of Myc transcripts in live sorted Wt FL cells or transduced EBF1-deficient cells as in panel B. Mean and SD are shown, n = 4, from 4 samples. (F) The ratio of MYC median fluorescent intensity (MFI) of each stage of the cell cycle compared with G0 in Ebf1-deficient cells transduced with EBF1- or PAX5-encoding vectors. Mean and standard error of the mean are shown; n = 3. (G) Gene set enrichment analysis of genes in HALLMARK_MYC_TARGET_V1 gene set based on RNA-sequencing data normalized per reads per kilobase of transcript, per million mapped reads from Ebf1−/− FL cells transduced with a control GFP or PAX5 encoding virus. (H) Representative histograms of Ebf1−/− BM cells rescued to the CD19+ pro–B-cell stage by transduction with either a conventional or ER-fused EBF1-encoding retrovirus and transduced with a Cas9-encoding virus alone or in combination with a Pax5-targeting gRNA. (I) MFI values for PAX5 levels as determined by flow cytometry. Mean and SD are shown; n = 4, from 4 individual samples. (J) Cell recovery after 3 days of in vitro culture of EBF1- or EBF1-ER–transduced cells expressing Cas9 alone or Cas9 in combination with gRNAs targeted to the Pax5 gene (gPAX5). Mean and SD are shown; n = 4, from 4 individual samples. For panels A-E and I-J, each dot indicates a data point, and the statistical analyses are based on a Student unpaired t test. *P < .05; **P < .01; ***P < .001; ****P < .0001. FDR = false discovery rate; NES = normalized enrichment score.
PAX5 acts as a negative regulator of cell proliferation and MYC function in pro-B cells. (A) Cell recovery 3 days after seeding of 2000 sorted GFP+CD45+ in vitro expanded FL cells from Ebf1−/− mice exposed to nuclear EBF1 by cultivation in 4-OHT for 4 or 7 days before sorting and reseeding in cultures in the absence of 4-OHT. Mean and standard deviation (SD) are shown; n = 5 to 6, from 2 independent experiments. Total cell recovery (B) and the fraction of CD19+ cells (C) recovered 4 days after seeding 2000 GFP+Ebf1−/− FL cells transduced with either MIG-control, EBF1, or PAX5 encoding virus. Mean and SD are shown; n = 7, from 2 independent experiments. (D) Cell cycle data from Ebf1−/− FL cells transduced with MIG-control, EBF1, or PAX5 encoding virus as determined by FACS analysis. Mean and standard error of the mean are shown; n = 3. (E) Quantitative reverse transcription PCR analysis determining the levels of Myc transcripts in live sorted Wt FL cells or transduced EBF1-deficient cells as in panel B. Mean and SD are shown, n = 4, from 4 samples. (F) The ratio of MYC median fluorescent intensity (MFI) of each stage of the cell cycle compared with G0 in Ebf1-deficient cells transduced with EBF1- or PAX5-encoding vectors. Mean and standard error of the mean are shown; n = 3. (G) Gene set enrichment analysis of genes in HALLMARK_MYC_TARGET_V1 gene set based on RNA-sequencing data normalized per reads per kilobase of transcript, per million mapped reads from Ebf1−/− FL cells transduced with a control GFP or PAX5 encoding virus. (H) Representative histograms of Ebf1−/− BM cells rescued to the CD19+ pro–B-cell stage by transduction with either a conventional or ER-fused EBF1-encoding retrovirus and transduced with a Cas9-encoding virus alone or in combination with a Pax5-targeting gRNA. (I) MFI values for PAX5 levels as determined by flow cytometry. Mean and SD are shown; n = 4, from 4 individual samples. (J) Cell recovery after 3 days of in vitro culture of EBF1- or EBF1-ER–transduced cells expressing Cas9 alone or Cas9 in combination with gRNAs targeted to the Pax5 gene (gPAX5). Mean and SD are shown; n = 4, from 4 individual samples. For panels A-E and I-J, each dot indicates a data point, and the statistical analyses are based on a Student unpaired t test. *P < .05; **P < .01; ***P < .001; ****P < .0001. FDR = false discovery rate; NES = normalized enrichment score.
Cd19 expression is linked to its transcriptional activation by PAX5, a transcription factor suggested to suppress Myc expression.7,31 Because the Pax5 gene is a target of EBF1,32 this finding suggests that EBF1 and PAX5 function with opposing activities in a regulatory loop controlling Myc expression. This idea was supported by the fact that ectopic expression of PAX5 in Ebf1−/− cells resulted in reduced cell expansion and formation of CD19+ cells 4 days after transduction (Figure 5B-C). The levels of PAX5 protein 24 hours after transduction were comparable to those observed in Wt cells, arguing against the theory that the observed phenotype was a result of abnormally high PAX5 levels enforced by the retroviral construct (supplemental Figure 3). The impact of PAX5 expression on cell proliferation was reflected by the accumulation of cells in G0 (Figure 5D). Determination of the Myc expression levels in the surviving PAX5-expressing cells by quantitative reverse transcription PCR 72 hours after virus transduction revealed reduced levels compared with those of EBF1-transduced cells (Figure 5E). Analysis of MYC protein levels as a function of cell cycle stage 48 hours after transduction with PAX5- or EBF1-expressing MIG virus revealed a small but significantly increased ratio of MYC protein in G0 vs G1 in the PAX5-transduced cells (Figure 5F). Furthermore, RNA-sequencing analysis of PAX5-transduced Ebf1−/− cells followed by gene set enrichment analysis (Figure 5G) revealed a reduction of the MYC-associated transcriptional program, supporting the idea that PAX5 functions as a negative regulator of Myc expression in normal B-cell progenitors.
To study the direct role for PAX5 in the induction of EBF1 dependency, we used CRISPR-Cas9–mediated gene targeting to inactivate the Pax5 gene in CD19+Ebf1−/− BM cells expressing either EBF1 or EBF1-ER. FACS analysis of the targeted cells revealed the generation of a CD19– population (Figure 5H) expressing reduced levels of PAX5 (Figure 5I) upon expression of Pax5 single guide RNAs. Assessing the ability of the CD19– cells to expand in the absence of 4-OHT, we noted a significant increase in cell recovery of EBF1-ER–rescued cells compared with cells expressing normal levels of PAX5 (Figure 5J). These data, in combination with the observation that PAX5 binds to regulatory elements in the Myc gene (Figure 3A), support the theory that EBF1 and PAX5 create a regulatory loop to regulate cell proliferation in pro-B cells.
Putative regulatory elements in the human MYC locus are targeted by EBF1 and PAX5 in pro-B ALL cells
To determine whether the human MYC gene is targeted by EBF1 and/or PAX5, we took advantage of a combination of ChIP-sequencing, ATAC-sequencing, and PLAC-sequencing data22 to identify regulatory elements interacting with the MYC promoter in the human pre–B cell line NALM6. This analysis identified several distal elements displaying ATAC accessibility and H3K27 acetylation. Several of these elements bound both EBF1 and PAX5 (Figure 6A), revealing that the human MYC gene is targeted by both proteins via several putative regulatory elements. Interestingly, this analysis also supported the hypothesis that the MYC gene is targeted by IKZF1 and RUNX1, which are both frequently mutated and generate fusion proteins in combination with PAX5 and EBF1 in human B-ALL.3-5 Hence, the regulatory regions of the human MYC gene may represent a hub for oncoprotein interaction in B-ALL.

Putative regulatory elements in the human MYC gene is targeted by EBF1 and PAX5 in pro-B ALL cells. (A) ChIP-sequencing, ATAC-sequencing, and PLAC-sequencing tracks for the human MYC (c-MYC) gene displayed in the WashU Epigenome Browser. Data were re-analyzed from Okuyama et al22 (GSE126300). (B) Schematic drawing of a model for regulatory loops controlling Myc expression in development.
Putative regulatory elements in the human MYC gene is targeted by EBF1 and PAX5 in pro-B ALL cells. (A) ChIP-sequencing, ATAC-sequencing, and PLAC-sequencing tracks for the human MYC (c-MYC) gene displayed in the WashU Epigenome Browser. Data were re-analyzed from Okuyama et al22 (GSE126300). (B) Schematic drawing of a model for regulatory loops controlling Myc expression in development.
Discussion
Here, we report that Myc is a direct and critical target for EBF1. Because MYC is reportedly essential for B-cell development,25,26 our findings provide a potential explanation for the importance of EBF1 in normal pro–B-cell survival and expansion.11-13 Although the functional activity of MYC is regulated at multiple levels, including translation, protein stability, and interplay with interacting partners,28 our data suggest that EBF1 directly targets regulatory elements in the Myc locus in nontransformed cells. The regulation of the MYC gene has been extensively studied due to the role of this protein in human malignancies.33 Although MYC is broadly expressed, the mouse Myc locus is targeted by multiple transcription factors in different tissues, including the lineage-restricted transcription factor GATA3 in developing T cells.34 Myc is under the influence of both proximal and distal control elements, including the BENC superenhancer region located ∼1.7 Mbp from the coding gene.29 As several of the enhancer elements identified display reduced ATAC accessibility in EBF1-deficient cells (Figure 3B), our data support the idea that the BENC region harbors several independently activated regulatory elements. Of note is that the D element, located in the BENC region and shown to be of importance for B-cell development, overlaps with the E4 element defined in this report. Due to the lack of suitable gRNAs, we did not target this EBF1-binding site. However, even though the D deletion spanned ∼1000 bp, these data collectively suggest the presence of 2 functionally important EBF1-binding regions in the BENC enhancer. The observation that mutation of any of these elements causes reduced cell growth (Figure 4E) suggests that despite the complexity of this enhancer cluster, there is limited functional redundancy. Hence, although the general idea that transcription regulatory circuits are stable persists,35 Myc highlights that the complex interplay between enhancer elements in development36 may be modulated to fine-tune transcriptional programs to create lineage-specific regulatory modules.
Because the Pax5 gene is a direct target for EBF1,32 our data suggest that these proteins create a regulatory loop directly involved in the control of pro–B-cell expansion. Furthermore, because EBF1 acts upstream of PAX5 in B-lymphocyte development, PAX5-mediated repression of cell expansion in the absence of EBF1 would promote an ordered differentiation process. A direct link between expression of a fate-determining factor such as EBF111,15,37,38 and regulation of cell survival and expansion may also be of significance for the preservation of lineage identity. Although this would be important in normal development, it is notable that MYC-induced B-cell lymphomas display lineage plasticity.39 Furthermore, cells carrying mutations in the Ebf1 and/or Pax5 genes can be converted into T-cell ALL21 or even myeloid leukemia.40 This may be relevant for leukemia progression as lineage plasticity is emerging as a potential challenge in lineage-targeted treatment of leukemias.40-42
Our data also provide an insight into how the dosage of lineage-determining factors affects normal differentiation.19,43,44 We report here that a key regulator of cell proliferation (MYC) is subject to both positive and negative regulation by 2 transcription factors in the same network. Reduced functional dosage of PAX5 could, in this regulatory loop, cause EBF1 to drive Myc transcription to higher-than-normal levels (Figure 6B). The complexity of this loop may be extended even further because it has been reported that the mouse Ebf1 gene contains an MYC-responsive enhancer element25 and that PAX5 acts as a positive regulator of N-Myc.45 The frequent mutations in PAX52-5 could result in a disruption of the regulatory feedback loop at the MYC locus, causing EBF1 to superactivate this gene. It should be noted, however, that the role of EBF1 in a transformed cell appears different from that in normal cells. Requirements for EBF1 in pro-B cells can be circumvented by malignant transformation,13 and it has recently been suggested that EBF1 is a repressor of Myc transcription in a mouse model for leukemia.31 Despite the apparently distinct functions of EBF1 in normal and malignant cells, reanalysis of EBF1 ChIP-sequencing data from normal and transformed cells did not reveal any obvious differences in EBF1 binding at the elements defined in this report. Hence, the mechanism underlying these apparently opposing functions of EBF1 reside in more complex events than alterations in direct DNA binding at these elements.
Although data obtained in mouse models should be extrapolated to human disease with great care, our data suggest that the MYC gene may be targeted by several of the key regulators of normal and malignant B-cell development in humans (Figure 6A). Considering the critical role of MYC in the control of metabolism, cell survival, and proliferation in normal and malignant cells,28,46 resolution of the functional interplay between key transcription factors at this locus will likely provide additional insights into the basic mechanisms of neoplastic transformation.
The online version of this article contains a data supplement.
The publication costs of this article were defrayed in part by page charge payment. Therefore, and solely to indicate this fact, this article is hereby marked “advertisement” in accordance with 18 USC section 1734.
Acknowledgments
The authors are grateful for the technical assistance provided by Liselotte Lenner, Linda Bergström, and Maria Malmberg.
This work was supported by grants from the Swedish Cancer Society (2017-258), the Swedish Childhood Cancer Foundation (2019-0020), the Swedish Research Council (2018-02448), including a Strategic research grant to Stem Therapy, Knut and Alice Wallenberg’s Foundation (2014-0089), and a donation from Henry Hallberg (all, M.S.) and Lions forskningsfond mot folksjukdomar (T.S.). J.R.H. is funded by the National Institutes of Health, National Institute of Allergy and Infectious Diseases (R21AI115696), and by the Wendy Siegel Fund for Leukemia and Cancer Research.
Authorship
Contribution: K.O., T.S., R.S., C.T.J., J.T.-G., M.P., J.Å., M.S., and J.U. designed, conducted, and analyzed experiments; S.S., J.U., C.T.J., and T.S. contributed to the bioinformatics analysis; J.R.H. and X.W. contributed essential reagents and analyzed data; M.S. designed experiments, analyzed data, and wrote the manuscript draft; and all authors contributed to the final version of the manuscript.
Conflict-of-interest disclosure: The authors declare no competing financial interests.
Correspondence: Mikael Sigvardsson, Division of Molecular Hematology, BMC B12, 22184 Lund, Sweden; e-mail: mikael.sigvardsson@med.lu.se.

This feature is available to Subscribers Only
Sign In or Create an Account Close Modal