

Key Points
HIV incidence in first-time donors was similar before and after implementation of the 12-month MSM deferral, both overall and in males.
The residual risk of HIV transfusion transmission for components sourced from first-time donors was low and did not change significantly.

Abstract
In 2015, the US Food and Drug Administration published revised guidance that recommended a change in blood donor deferral of men who have sex with men (MSM) from an indefinite to a 12-month deferral since the donor last had sex with a man. We assessed whether HIV incidence in first-time blood donors or associated transfusion risk increased. Donations in 4 major blood collection organizations were monitored for 15 months before and 2 years after implementation of the 12-month MSM deferral policy. HIV-positive donations were classified as recently acquired or long-term using a recent infection testing algorithm and incidence in both periods estimated. Residual transfusion transmission risk was estimated by multiplying incidence by the length of the infectious window period. The latter was estimated using a model based on infectious dose and the sensitivity of nucleic acid testing. Factors associated with incident infection in each period were assessed using Poisson regression. Overall HIV incidence in first-time donors before implementation of the 12-month MSM deferral was estimated at 2.62 cases per 100 000 person-years (105 PY) (95% credible interval [CI], 1.53-3.93 cases/105 PY), and after implementation at 2.85 cases/105 PY (95% CI, 1.96-3.93 cases/105 PY), with no statistically significant change. In male first-time donors, the incidence difference was 0.93 cases/105 PY (95% CI, −1.74-3.58 cases/105 PY). The residual risk of HIV transfusion transmission through components sourced from first-time donors was estimated at 0.32 transmissions per million (106) packed red blood cell transfusions (95% CI, 0.29-0.65 transmissions/106 transfusions) before and 0.35 transmissions/106 transfusions (95% CI, 0.31-0.65 transmissions/106 transfusions) after implementation. The difference was not statistically significant. Factors associated with incident infection were the same in each period. We observed no increase in HIV incidence or HIV transfusion transmission risk after implementation of a 12-month MSM deferral policy.
Introduction
From 1985 to 2015, the US Food and Drug Administration (FDA) recommended that blood collection organizations indefinitely defer male donors who have had sex with another male, even one time, since 1977. In December 2015, the FDA revised its guidance to recommend a time-limited deferral of men who have sex with men (MSM) for 12 months since last MSM sex,1 and in April 2020, the FDA recommended a further reduction in the deferral period to 3 months since last MSM sex.2 The 12-month deferral period was implemented by blood collection organizations during 2016. It is critical to monitor the potential impact of these donor eligibility changes on HIV incidence in blood donors and on the risk of HIV transmission through blood transfusion. Because newly eligible male donors with MSM contacts outside the deferral period would have presented to blood centers primarily as first-time donors, the change in deferral policy would be expected to have had the greatest impact on HIV prevalence and incidence in male first-time donors. During the study period (2015-2018), ~20% of all collections were from first-time donors, of whom 48% were male.
In September 2015, the FDA in collaboration with the National Heart, Lung, and Blood Institute of the National Institutes of Health and the Department of Health and Human Services, Office of the Assistant Secretary for Health, launched the Transfusion-Transmissible Infections Monitoring System (TTIMS) to establish an integrated, comprehensive monitoring system for transfusion-transmissible infections (TTIs) in the United States.3 In addition to monitoring the markers of TTIs such as HIV, hepatitis B virus, and hepatitis C virus for estimation of disease prevalence among all donors and incidence in repeat donors, TTIMS implemented a recent infection testing algorithm (RITA) for HIV-positive samples from first-time donors as the primary method for estimating incidence in first-time donors. TTIMS monitors donations in all blood centers affiliated with 4 major blood collection organizations: the American Red Cross, New York Blood Center, OneBlood, and Vitalant, which together represent approximately 60% of the US blood supply.4
We estimated HIV incidence in first-time donors before and after implementation of the 12-month MSM deferral policy, evaluated incidence differences between these 2 periods, and assessed demographic correlates of incident infection in first-time donors. Because the major source of residual risk of HIV transfusion transmission is from donations made in the prenucleic acid testing (NAT) infectious window period (ie, before NAT positivity or seroconversion), we also transformed incidence estimates into residual risk estimates for first-time donors using a well-established model for the infectious window period.5
Methods
Study design, setting, and participants
The TTIMS program monitored all donations by first-time blood donors that were collected by the participating blood collection organizations during the 15 months leading up to each center implementing the 12-month MSM deferral and up to December 2018, which allowed analysis of data for approximately 24 months after implementation. The pre- and postimplementation periods for each blood collection organization are closely aligned, but not identical, because of slightly different implementation dates (supplemental Appendix A; supplemental Figure A1, available on the Blood Web site). Wherever possible, residual samples from blood units identified as HIV-positive through routine screening were further tested to ascertain recency status at time of HIV-positive donation using the RITA. Details on the RITA are provided in supplemental Appendix B.
Laboratory methods
All donations were screened for anti-HIV antibodies using the PRISM HIV O Plus chemiluminescent immunoassay (Abbott Laboratories, Abbott Park, IL) and HIV-1 RNA using the Procleix Ultrio Plus NAT assay (Grifols, San Diego, CA). Donation samples tested confirmed seroreactive and NAT-positive were deemed concordant positive according to TTIMS consensus definitions.4 Concordant positive samples were further tested with the HIV-1 Limiting Antigen (LAg)-Avidity enzyme immunoassay (Sedia Biosciences Corporation, Beaverton, OR) and the Aptima HIV-1 viral load assay (Hologic, Marlborough, MA). The LAg-Avidity assay identifies recently acquired infections by measuring antibody avidity (which matures during the early months of HIV infection) using a limiting concentration of recombinant HIV-1 antigen.6 LAg-Avidity normalized optical density (ODn) results ≤2.0 triggered triplicate retesting, and the median value of triplicate repeat tests constituted the final result. A range of recency discrimination threshold combinations (LAg-Avidity ODn and viral load) were considered (supplemental Appendix B). NAT yield donations (ie, HIV-1 NAT-positive and seronegative by routine screening) were considered recently infected. Donations that were seropositive, confirmed as such by independent methods,4 and NAT-negative during screening were considered virally suppressed (indicating either elite control or undisclosed antiretroviral use) and therefore classified as probable long-term infections.
Statistical methods
Because RITA properties (MDRI and FRR) are known to vary with viral and population characteristics (eg, HIV-1 subtype mix), we estimated US blood donor–specific MDRIs for a range of RITAs consisting of different combinations of LAg-Avidity ODn and viral load thresholds by means of a Bayesian analysis of TTIMS repeat donor data. Informative priors were derived from conventional analyses of seroconverter cohort data, and we used HIV-1 clade B-specific FRR estimates.8 The estimation of RITA performance characteristics, identification of an optimal algorithm, and related sensitivity analyses are described in supplemental Appendix B.
We estimated incidence differences to evaluate potential change in incidence between the pre- and post-implementation periods. The variance and credible intervals of incidence estimates and incidence difference estimates were approximated using a bootstrapping approach. We drew 1 000 000 sets of , , , and from truncated normal distributions, with means and standard deviations set according to the estimates of each parameter from the data (and assumed to be independent). Credible intervals represent the 2.5th and 97.5th percentiles of the bootstrapped estimates, with negative incidence estimates set to 0 during bootstrapping. To avoid underestimating uncertainty in cases in which observed or was 0 or 1, we used a formula for the standard deviation based on the Clopper-Pearson exact confidence interval (CI).9 We additionally report CIs and P values based on Δ method approximation in supplemental Table 1. To account for multiple comparisons in the incidence differences, we applied the Bonferroni correction (supplemental Figure 2).
In the case of a cross-sectional survey with pseudo-instantaneous data collection, the cross-sectional incidence estimator yields a weighted average of recent incidence over the period T before the survey, weighted by a function that captures the dynamics of the recency test. In analyzing first-time donor data collected over an extended period, the implied temporal weighting is more complicated, and results were generated from a model that reflects the temporal weighting inherent in the estimator and the density of donations over the period (see supplemental Appendix A). A slight spillover of pre-implementation incidence into the post-implementation estimate occurs when data collected during the immediate post-implementation period are included. We used all data from the period, but we report a sensitivity analysis in which we exclude data from the 3, 6, and 9 months immediately following implementation (supplemental Figure 1), including an analysis in which all temporal spillover is eliminated (supplemental Appendix A).
Residual risk of transfusion transmission of HIV
We adapted the model of Weusten et al5 to estimate the infectious window period with minipool NAT (MP-NAT) screening of donations, for packed red blood cell (pRBC) and fresh frozen plasma (FFP) blood components (Residual risk of HIV-TT, version 1.1; https://doi.org/10.5281/zenodo.3588570). The model incorporates a dose-response model (for probability of HIV transfusion transmission as a function of transfused virions)10 and a function that interprets estimates of the sensitivity of the screening assay into a function for the probability of viral RNA not being detected by NAT. By multiplying the infectious window period estimates by the incidence estimates (normalized to the same units of time) for all first-time donors and male first-time donors, we obtained the residual risk of HIV transfusion transmission despite routine blood screening. To obtain 95% credible intervals for the infectious window period and residual risk estimates, we drew 25 000 sets of parameters from distributions specified according to the available data. We further considered a worst-case scenario in which we assumed that a single virion in the transfused product was infectious, that higher plasma volumes were transfused, and that the MP-NAT assay had lower sensitivity. We further used the upper credible limit of the incidence estimate. More details are provided in supplemental Appendix C.
Poisson regression to identify factors associated with incident infection
Ethics approval and informed consent
Study procedures were approved by the institutional review boards at the University of California San Francisco, American Red Cross, New York Blood Center, and FDA. Blood donors provided consent for the use of donation data and biospecimens in blood safety research at the time of donation.
Results
During the study period, 4.8 million donations from first-time donors were captured in the donor-donation database, of which 391 were confirmed as HIV-positive using FDA-licensed NAT and/or serologic assays. Demographic characteristics of first-time donors in the study period are given in Table 1.
Demographic characteristics of first-time donors and proportions HIV-positive in pre- and postimplementation periods
| Group | Preimplementation period | Postimplementation period | ||||
|---|---|---|---|---|---|---|
| Donations N (% of total) | HIV+ N | HIV+ /105 (95% CI)* | Donations N (% of total) | HIV+ N | HIV+ /105 (95% CI)* | |
| Sex† | ||||||
| Male | 867 223 (48.1) | 105 | 12.11 (9.90-14.66) | 1 415 738 (47.4) | 212 | 14.98 (13.03-17.13) |
| Female | 937 534 (51.9) | 25 | 2.67 (1.73-3.94) | 1 569 234 (52.6) | 49 | 3.12 (2.31-4.13) |
| Age group, y | ||||||
| 16-17 | 449 204 (24.9) | 10 | 2.23 (1.07-4.09) | 641 387 (21.5) | 31 | 4.83 (3.28-6.86) |
| 18-24 | 388 828 (21.5) | 31 | 7.97 (5.42-11.32) | 580 174 (19.4) | 57 | 9.83 (7.44-12.73) |
| 25-39 | 424 687 (23.5) | 56 | 13.19 (9.96-17.12) | 757 303 (25.4) | 94 | 12.41 (10.03-15.19) |
| 40-54 | 308 752 (17.1) | 30 | 9.72 (6.56-13.87) | 551 729 (18.5) | 60 | 10.88 (8.30-14.00) |
| 55+ | 233 303 (12.9) | 3 | 1.29 (0.27-3.76) | 454 417 (15.2) | 19 | 4.18 (2.52-6.53) |
| Race/ethnicity | ||||||
| White | 1 190 489 (66.0) | 36 | 3.02 (2.12-4.19) | 2 069 287 (69.3) | 82 | 3.96 (3.15-4.92) |
| Black or African American | 127 762 (7.1) | 65 | 50.88 (39.27-64.84) | 211 055 (7.1) | 109 | 51.65 (42.41-62.30) |
| Asian | 66 745 (3.7) | 1 | 1.50 (0.04-8.35) | 125 360 (4.2) | 4 | 3.19 (0.87-8.17) |
| Hispanic/Latino ethnicity | 249 256 (13.8) | 20 | 8.02 (4.90-12.39) | 434 662 (14.6) | 51 | 11.73 (8.74-15.43) |
| Other race/ethnicity‡ | 170 522 (9.4) | 8 | 4.69 (2.03-9.24) | 144 646 (4.8) | 15 | 10.37 (5.80-17.10) |
| Geographic region§ | ||||||
| Midwest | 394 636 (21.9) | 11 | 2.79 (1.39-4.99) | 615 126 (20.6) | 26 | 4.23 (2.76-6.19) |
| Northeast | 334 941 (18.6) | 12 | 3.58 (1.85-6.26) | 526 052 (17.6) | 21 | 3.99 (2.47-6.10) |
| South | 673 702 (37.3) | 92 | 13.66 (11.01-16.75) | 1 098 826 (36.8) | 169 | 15.38 (13.15-17.88) |
| West | 400 414 (22.2) | 15 | 3.75 (2.10-6.18) | 743 374 (24.9) | 45 | 6.05 (4.42-8.10) |
| Total | 1 804 774 (100.0) | 130 | 7.20 (6.02-8.55) | 2 985 010 (100.0) | 261 | 8.74 (7.72-9.87) |
Only allogeneic first-time donations with valid HIV results and known donation procedure included.
Confidence intervals were calculated using the Clopper-Pearson exact method, which is conservative.9
In the preimplementation period, 17 first-time donations lacked sex information, and in the postimplementation period, 38 donations lacked sex information.
Combined category consisting of American Indian or Alaska Native, more than one race, other race, and unknown race/ethnicity. In the preimplementation period, 6.3% of first-time donations had missing race/ethnicity and in the postimplementation period, 1.5% of first-time donations had missing race/ethnicity.
First-time donations from donors residing outside the continental United States (304 in the preimplementation period and 598 in the postimplementation period) and with missing residence information (777 in the preimplementation period and 1034 in the postimplementation period) were excluded.
HIV prevalence and incidence in first-time donors
The prevalence of HIV in first-time donors (proportion HIV-positive) was 7.20 per 100 000 (/105) (95% confidence interval [CI], 6.02-8.55/105) with 130 HIV-positive samples identified in the 15-month period before implementation of the 12-month MSM deferral and 8.74/105 (95% CI, 7.72,9.87/105) with 261 HIV-positive samples identified in the ∼24-month period after implementation. The prevalence did not change significantly. Table 1 presents prevalence in demographic and geographic groups.
Incidence estimates for the pre- and postimplementation periods overall and by sex, race/ethnicity, and geographic region are provided in Table 2. HIV incidence in first-time donors during the pre-implementation period was 2.62 cases per 100 000 person-years (/105 PY) (95% credible interval [CI], 1.53-3.93 cases/105 PY), and during the post-implementation period, it was 2.85 cases/105 PY (95% CI, 1.96-3.93 cases/105 PY). The estimated incidence difference (between pre- and post-implementation periods) was not statistically significant at 0.23 cases/105 PY (95% CI, −-1.20-1.63 cases/105 PY). In male first-time donors, the incidence rates in the 2 respective periods were 4.21 cases/105 PY (95% CI, 2.25-6.56 cases/105 PY) and 5.14 cases/105 PY (95% CI, 3.42-7.21 cases/105 PY) with the difference also not significant (0.93 cases/105 PY; 95% CI, –1.74-3.58 cases/105 PY). Incidence differences with 95% credible intervals are shown in Figure 1.
HIV incidence in US first-time blood donors by demographic group
| Group | Preimplementation period incidence /105 PY (95% CI) | Postimplementation period incidence /105 PY (95% CI) |
|---|---|---|
| All FT donors | 2.62 (1.53-3.93) | 2.85 (1.96-3.93) |
| Sex* | ||
| Male | 4.21 (2.25-6.56) | 5.14 (3.42-7.21) |
| Female | 1.17 (0.24-2.41) | 0.80 (0.22-1.50) |
| Age group | ||
| 16-17 | 1.82 (0.44-3.82) | 2.96 (1.32-5.11) |
| 18-24 | 5.65 (2.53-9.71) | 5.48 (2.96-8.65) |
| 25-39 | 3.13 (0.69-6.04) | 2.01 (0.55-3.67) |
| 40-54 | 1.11 (0.00-3.31) | 2.67 (0.81-4.88) |
| 55+ | 0.00 (0.00-2.30)† | 1.12 (0.04-2.75) |
| Race/ethnicity | ||
| White | 1.96 (0.94-3.28) | 0.80 (0.25-1.44) |
| Black or African American | 12.16 (3.19-22.68) | 20.29 (12.00-30.36) |
| Asian | 2.51 (0.06-5.99) | 1.71 (0.03-6.23) |
| Hispanic/Latino ethnicity | 1.55 (0.00-4.41) | 4.50 (1.95-7.67) |
| Other race/ethnicity‡ | 0.98 (0.00-3.78) | 2.37 (0.00-6.76) |
| Geographic region§ | ||
| Midwest | 1.49 (0.16-3.59) | 1.06 (0.03-2.56) |
| Northeast | 0.99 (0.00-2.83) | 1.49 (0.26-3.14) |
| South | 5.60 (3.06-8.69) | 4.92 (3.08-7.13) |
| West | 0.00 (0.00-2.34)† | 2.18 (0.76-3.92) |
No incidence differences between pre- and postimplementation periods were statistically significantly different. See Figure 1.
Other and unknown sex were excluded (no HIV cases).
No recent cases; in bootstrapping procedure, the proportion of HIV-positive cases classified as recently infected was sampled from a truncated normal distribution with .
Combined category consisting of American Indian or Alaska Native, more than one race, other race, and unknown race/ethnicity.
US territories and unknown region were excluded (no HIV cases).
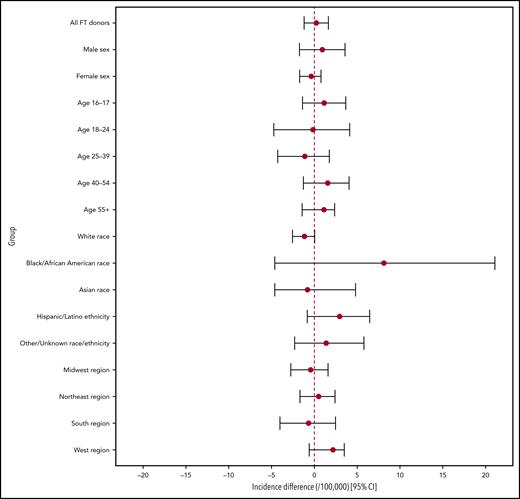
Incidence difference estimates: pre- vs post-implementation periods. The 95% credible intervals represent the 2.5th and 97.5th percentiles of 1 000 000 bootstrapped incidence difference estimates. Negative incidence estimates are set to zero in the bootstrapping procedure, because negative incidence is not possible, and CIs are therefore not necessarily symmetrical around the point estimate. Given the multiple comparisons taking place, a critical value of P = .05 may not be appropriate. See supplemental Figure 2 for incidence difference credible intervals based on the Bonferroni correction.
Incidence difference estimates: pre- vs post-implementation periods. The 95% credible intervals represent the 2.5th and 97.5th percentiles of 1 000 000 bootstrapped incidence difference estimates. Negative incidence estimates are set to zero in the bootstrapping procedure, because negative incidence is not possible, and CIs are therefore not necessarily symmetrical around the point estimate. Given the multiple comparisons taking place, a critical value of P = .05 may not be appropriate. See supplemental Figure 2 for incidence difference credible intervals based on the Bonferroni correction.
Incidence estimates were notably higher for both periods in first-time donors who were age 18 to 24 years, were black or African American, and lived in the South. In no group was there a statistically significant difference between the 2 periods (supplemental Table 1; supplemental Figure 2). The delta approximation method of the variance of incidence estimates and incidence difference estimates (in addition to bootstrapping) did not indicate significant incidence differences in all first-time donors or in any subgroup between the 2 periods. When the Bonferroni correction for multiple comparisons was applied, no P value was close to the critical value of 0.003125 (supplemental Table 1; supplemental Figure 3).
Residual risk of transfusion transmission of HIV
The infectious window periods for pRBC and FFP donations (conventionally assumed to contain 20 mL and 200 mL of plasma in the final product, respectively5,13 ), when screening units with the Procleix Ultrio Plus NAT assay14 in minipools of 16 samples, were estimated at 4.49 days (95% CI, 3.56-6.85 days) and 7.33 days (95% CI, 6.33-9.41 days), respectively. In the period before implementation of the new MSM deferral policy, the risks of transfusion transmission with components obtained from first-time donors were estimated at 0.32 transmissions per million (106) pRBC transfusions (95% CI, 0.29-0.65 transmissions/106 transfusions) and 0.53 transmissions/106 FFP transfusions (95% CI, 0.50-0.91 transmissions/106 transfusions). In the period after implementation, the risks were 0.35 transmissions/106 pRBC transfusions (95% CI, 0.31-0.65 transmissions/106 transfusions) and 0.57 transmissions/106 FFP transfusions (95% CI, 0.54-0.92 transmissions/106 transfusions). For transfused components derived from male first-time donors, the residual risks were estimated at 0.52 transmissions/106 pRBC transfusions (95% CI, 0.47-1.07 transmissions/106 transfusions) and 0.84 transmissions/106 FFP transfusions (95% CI, 0.81-1.52 transmissions/106 transfusions) in the period before implementation and at 0.63 transmissions/106 pRBC transfusions (95% CI, 0.56-1.19 transmissions/106 transfusions) and 1.03 transmissions/106 FFP transfusions (95% CI, 0.97-1.68 transmissions/106 transfusions) in the period after implementation. The differences in residual risks of HIV transfusion transmission through pRBC and FFP components obtained from all first-time donors and male first-time donors between the 2 periods were not statistically significant using a 2-tailed z test. The worst-case scenario residual risk estimates, based on maximum credible incidence during the period after implementation and conservative assumptions, were 0.95 transmissions/106 pRBC transfusions and 1.23 transmissions/106 FFP transfusions (supplemental Appendix C; supplemental Table C2).
Factors associated with incident infection
The Poisson regression model with time of donation as the only predictor (model 1) did not yield a statistically significant result: the IRR for donating during the postimplementation period (compared with the pre-implementation period) was estimated at 1.26 (95% CI, 0.78-2.08). In model 2, with demographic variables as well as the time of donation, IRR pre- vs postimplementation adjusted for demographic covariates remained nonsignificant at 1.29 (95% CI, 0.80-2.14). We therefore dropped time of donation from the final model (model 3). Adjusted IRRs for the demographic variables are reported in Figure 2. Male sex (compared with female sex) was significantly associated with incident infection (adjusted IRR, 5.02; 95% CI, 2.85-9.55), as was age 18 to 24 years compared with age older than 55 years (adjusted IRR, 4.12; 95% CI, 1.44-17.40), as well as black or African American race and Hispanic/Latino ethnicity (compared with white race) with adjusted IRRs of 9.81 (95% CI, 5.64-17.41) and 2.48 (95% CI, 1.22-4.88), respectively. Being a resident in the South census region at the time of donation also yielded a significant adjusted IRR of 2.95 (95% CI, 1.35-7.76) compared with being a resident in the Midwest census region. These IRRs and their CIs are shown in Figure 2.
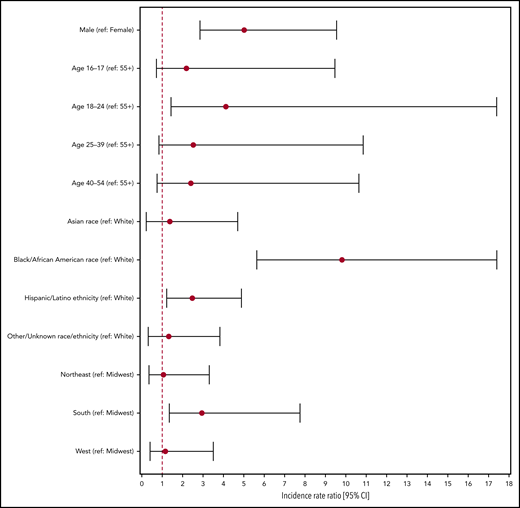
Adjusted incidence rate ratios for demographic covariates of incident infection obtained from multivariable Poisson regression. The Poisson regression model excludes data for which sex or region of residence is unknown or outside the continental United States.
Adjusted incidence rate ratios for demographic covariates of incident infection obtained from multivariable Poisson regression. The Poisson regression model excludes data for which sex or region of residence is unknown or outside the continental United States.
Discussion
Our overall and male-only estimates of HIV incidence in US first-time blood donors during the 15 months preceding and approximately 2 years after implementation of a 12-month MSM deferral policy were similar. The 95% credible intervals around incidence difference estimates include 0. These results indicate that the change from an indefinite deferral to a 12-month deferral after last MSM sex did not result in a statistically significant increase in HIV incidence or in associated residual transfusion risk from first-time donors. This is in line with findings from other industrialized countries in which reduced deferral periods have been implemented. Direct estimates of HIV incidence in first-time donors are not usually available, except in France where a recency assay is used and where no increase in HIV incidence or residual risk was observed after the introduction of a 12-month deferral period.15 Modeled risks in the United Kingdom and Canada were deemed low enough to support the implementation of 3-month deferral periods.16,17
We did not observe any evidence that a cohort of new higher-risk male donors entered the donor pool after the policy implementation. The failure to identify a significant association between period of donation and incident infection in the multivariable regression analysis, even when controlling for known correlates of risk, lends further weight to the conclusion that there is no evidence that HIV incidence in first-time donors or first-time male donors increased after implementation of the revised MSM eligibility criteria.
Our results in first-time donors do, however, reflect the uneven distribution of the risk of HIV in donors and the US population. Higher incidence among male and younger donors, much higher incidence observed in black or African American donors (10-fold higher than in white donors, when controlling for sex, age, and residence region), and to a lesser extent in Hispanic/Latino donors and those residing in the South, are consistent with earlier findings18-21 and point to systemic health disparities that warrant intensified HIV prevention, testing, and treatment efforts.22-26
Given that TTIMS includes data on donations collected in all US states other than Hawaii and Alaska, our failure to detect a significant increase in incidence overall or in any demographic or geographic subpopulation strongly suggests that the revised eligibility criteria did not lead to an increase in HIV risk in first-time blood donors.
Statistical power to detect incidence differences was limited by the relatively small number of HIV-infected donations identified during the study period. This was exacerbated by several samples for which confirmatory or additional RITA testing was not available, resulting in missing recency classifications. Statistical uncertainty in incidence and incidence difference estimates stems mainly from the rarity of HIV infection and (especially) of recent infection. A power calculation performed before the incidence analysis suggested that an incidence increase between study years of more than 100% would have been necessary to have an 80% probability of identifying a statistically significant increase. To maximize precision and optimize our use of the available data, we analyzed data in only 2 time bins—the periods before and after implementation—but a large increase would nevertheless have been required. To detect more subtle incidence trends, new approaches are required, such as smoothing methods that dispense with time bins and fit prevalence and incidence trends to time treated as a continuous predictor. We are pursuing methodologic research in this area.
Estimates of the residual risk of HIV transfusion transmission through blood products from first-time donors in the period after implementation of the new policy are in line with historical estimates of the risk for the US donor population.20,27,28 The residual risk estimates are low at substantially <1 transmission per million pRBC transfusions, even for components sourced from first-time male donors, a group at higher risk for HIV. Owing to the risk of transfusion-related acute lung injury, plasma components are disproportionately sourced from male donors. In TTIMS data for the study period, 63.5% of first-time donor plasmapheresis collections were from male donors. Given the higher incidence in male first-time donors, the residual risk associated with plasma sourced from first-time donors may therefore be slightly higher than the estimate based on overall first-time donor incidence.
We did not estimate an infectious window period or residual risk for platelets. According to the 2017 National Blood Collection and Utilization Survey, 91.3% of all platelet units distributed were collected using apheresis.29 The vast majority of platelet apheresis collections are from repeat donors: in TTIMS data, only 1.3% of collections were from first-time donors. Risk is further reduced by the increasing use of pathogen inactivation technology in platelet production, which would essentially eliminate the infectious window period, given the resulting several log reduction in HIV titers.30 The contribution of first-time donor-derived platelets to HIV risk in the US blood supply is therefore likely to be negligible.
Further studies are needed to ascertain whether this deferral change had any impact on donation behavior or resulted in donors giving blood without revealing risk behaviors that should have resulted in their deferral. Other changes in donor behavior may also impact blood safety. A case in point, as shown by Custer et al31 in this issue, is undisclosed antiretroviral therapy and the use of preexposure prophylaxis in blood donors.
The findings reported here are reassuring and support the conclusion that the change to a 12-month MSM deferral policy did not have an adverse impact on blood safety in the United States, and that a further reduction in the MSM deferral period to 3 months is unlikely to do so. It is critical, however, that TTIMS continues to monitor HIV prevalence, incidence, and transfusion transmission risk to assess the potential impact of the 3-month MSM deferral policy, changes in donor behavior, and increased use of preexposure prophylaxis on the safety of the US blood supply.
Access to deidentified data may be requested from the Transfusion-Transmissible Infections Monitoring System by contacting Brian Custer at bcuster@vitalant.org.
The online version of this article contains a data supplement.
The publication costs of this article were defrayed in part by page charge payment. Therefore, and solely to indicate this fact, this article is hereby marked “advertisement” in accordance with 18 USC section 1734.
Acknowledgments
The authors gratefully acknowledge those individuals below who contributed to TTIMS and without whom this program would not be successful: Inderdeep Singh, Dylan Hampton, Celine Cheng and Clara di Germanio (Vitalant Research Institute, San Francisco, CA), Val Green (Creative Testing Solutions, Tempe, AZ), Roger Dodd, Whitney Steele, Rahima Fayed, James Haynes and Meng Xu (American Red Cross Scientific Affairs, Rockville and Gaithersburg, MD), Carlos del Valle and Lisa Milan-Benson (New York Blood Center, New York, NY), Melissa Lopez (OneBlood, St. Petersburg, FL), Richard Forshee, Artur Belov and Barbee Whitaker (US Food and Drug Administration, Silver Spring, MD) and Alex Welte (DST-NRF Centre of Excellence in Epidemiological Modelling and Analysis, Stellenbosch University, Stellenbosch, South Africa). The authors thank the Consortium for the Evaluation and Performance of HIV Incidence Assays, led by Gary Murphy (Public Health England, London, United Kingdom), Michael P. Busch (Vitalant Research Institute, San Francisco, CA), Christopher D. Pilcher (University of California San Francisco, San Francisco, CA), and Alex Welte (Stellenbosch University, Stellenbosch, South Africa), as well as Oliver Laeyendecker, Thomas C. Quinn, Susan H. Eshleman, and Andrew Longosz (Johns Hopkins University School of Medicine, Baltimore, MD) for data on the performance of the LAg-Avidity assay, and Patrick Willey for help designing the visual abstract.
The authors are grateful for funding support (contracts HHSF223201510165C and HHSF223201510149C) for TTIMS from the FDA Center for Biologics Evaluation and Research, the National Institutes of Health/National Heart, Lung and Blood Institute (provided to the FDA in terms of interagency agreement Y01 AHL15003001-1-0-1), and the Health and Human Services (HHS) Office of the Assistant Secretary for Health, as well as the study guidance provided by these sponsors.
The content is solely the responsibility of the authors and does not represent the policy of the National Institutes of Health, the US Food and Drug Administration, or the US Department of Health and Human Services.
Authorship
Contribution: B.C., S.L.S., D.K., R.R., S.A.A., A.E.W., and S.A.G. designed the study and oversaw data collection; D.H., E.P.N., C.Q., and E.G. managed the data; M.S., S.B., and P.W. managed samples and conducted laboratory testing; E.G. developed statistical methods and analyzed the data; E.G. and B.C. wrote the initial draft; and E.G., M.P.B., E.P.N., R.B., C.Q., D.H., M.S., S.B., H.Y., P.W., D.K., R.R., S.L.S., S.A.G., S.A.A., A.E.W., and B.C. reviewed, edited, and approved the final version of the manuscript and are accountable for all aspects of the work.
Conflict-of-interest disclosure: E.G. and M.P.B. have received grant support from Sedia Biosciences Corporation for evaluation of an HIV recency assay. E.G. has received consulting fees from Sedia Biosciences Corporation for unrelated work. The remaining authors declare no competing financial interests.
A list of the steering committee members of the Transfusion-Transmissible Infections Monitoring System appears in the Appendix.
Correspondence: Eduard Grebe, Vitalant Research Institute, 270 Masonic Ave, San Francisco, CA 94118; e-mail: egrebe@vitalant.org.
Appendix
The Transfusion-Transmissible Infections Monitoring System is the responsibility of the following individuals: Brian Custer (Vitalant Research Institute, San Francisco, CA), Susan L. Stramer (American Red Cross, Gaithersburg, MD), Debra Kessler (New York Blood Center, New York, NY), Rita Reik (OneBlood, St. Petersburg, FL), Steven A. Anderson and Alan E. Williams (US Food and Drug Administration, Silver Spring, MD), and Simone A. Glynn (National Heart, Lung, and Blood Institute, National Institutes of Health, Bethesda, MD).
