


Introduction: MRI assessment of liver iron concentration (LIC) has become the standard of care for monitoring iron chelation strategies. The Ferriscan R2 quantification of LIC has been validated against 338 biopsies in two large cohorts, demonstrates good interstudy reproducibility, and has strong quality control practices. However, its cost remains a challenge for many institutions, making iron measurements by R2* acquisitions more attractive. Several studies comparing LIC by R2* and by Ferriscan R2 have identified substantial bias between R2* and R2 LIC estimates. We postulated that the original Ferriscan R2 calibration overestimates LIC at high iron concentrations, causing the disagreement between the two techniques.
Methods: We identified three studies comparing single echo R2 to liver biopsy (362 biopsies). We used a publicly available digital capture program(www.arizona-software.ch/graphclick) to capture the values of R2 for each liver iron concentration level. We fit the data to the existing FDA-approved calibration and compared Bland Altman agreement to liver biopsy against two other calibration curves. The first was data-derived from the aggregate liver biopsy results using a linear fit in log transformed LIC and R2 coordinates (resulting in a Power Law fit). The second was derived from a spline fit to data generated from previously published Monte Carlo simulation model from our laboratory. This model generates "synthetic" R2-iron pairs over the entire physiological range of iron overload, using ideal mathematical approximations to the MRI imaging physics.
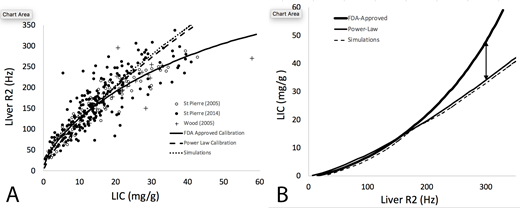
Results: Panel A demonstrates R2-LIC pairs for the aggregate liver biopsy data and the three evaluated R2-iron calibration curves. Using Bland-Altman analysis, both the Power Law (0.5 ± 4.9 mg/g) and Simulation (1.7 ± 5.1 mg/g) calibrations had 17-22% lower variance than the Ferriscan calibration (-1.1 ± 6.2 mg/g), p<0.0001 by two sample variance test. More importantly, the predicted LIC values diverge dramatically for R2 values greater than 155 Hz (roughly 14 mg/g) (Panel B). For example, a R2 value of 300 Hz will yield an estimated LIC of 48 mg/g by Ferriscan but only 34 mg/g and 32.5 mg/g by the Power Law and Simulation calibrations respectively.
Discussion: These data suggest that Ferriscan overestimates true liver iron concentration for R2 values exceeding 155 Hz, with the differences growing geometrically. The calibration error is sufficient to completely explain the differences between LIC by R2* and Ferriscan R2 described in previously studies. Importantly, any future attempt to "calibrate" R2* or other MRI methods against Ferriscan need to account for this bias.
Fortunately, the clinical impact of the observed calibration bias is manageable. Patients with LIC below 14 mg/g are being accurately risk stratified. Patients with LIC greater than 14 mg/g in their liver are universally at high risk and should be treated aggressively, regardless. Serial trends in LIC-R2 values also lessen the impact of calibration bias. Both Ferriscan and R2* LIC estimates and provide accurate estimates of chelator efficiency on an annual basis. Further, both Ferriscan and liver R2* LIC estimates are more accurate than liver biopsy in tracking changes in total body iron concentration. However, hematologists should treat Ferriscan predicted LIC values of more than 14 mg/g with appropriate caution and integrate the predicted LIC values with the patient's entire clinical picture to avoid over-reacting to large changes in predicted LIC.
ACKNOWLEDGEMENTS
This work supported by the National Institutes of Health, Diabetes, Digestive and Kidney Diseases (1R01DK097115-01A1).
DISCLOSURES
Dr. Wood serves as a consultant to Apopharma, Biomedinformatics, Bluebirdbio, Celgene, Ionis Pharmaceuticals, Imago Biosciences, Silence Therapeutics, and World Care Clinical.
Wood:National Institutes of Health: Research Funding; Celgene: Consultancy; Apopharma: Consultancy; WorldcareClinical: Consultancy; BluebirdBio: Consultancy; Imago Biosciences: Consultancy; BiomedInformatics: Consultancy; Philips Healthcare: Research Funding. Coates:celgene: Consultancy, Honoraria, Other: steering committee of clinical study; vifor: Consultancy, Honoraria; apo pharma: Consultancy, Honoraria, Speakers Bureau; agios pharma: Consultancy, Honoraria.
This icon denotes a clinically relevant abstract

This feature is available to Subscribers Only
Sign In or Create an Account Close Modal