Background
The combination of the αPD-1 (nivolumab) and hypomethylating agent azacytidine demonstrated encouraging response rate and overall survival in relapsed/refractory acute myeloid leukemia (AML) patients, compared to azacytidine alone1 (NCT02397720). However, the percentage of the patient who achieved an IWG 2016 response to such therapy was still limited (overall response rate = 33%), so it is desirable to have early predictive biomarkers to facilitate patient stratification and selection for future trials. A better understanding of T cells (primary targets of αPD-1 therapy) from bone marrow (BM) and peripheral blood (PB) in AML pre-therapy and on-therapy should yield valuable insights on the treatment-induced anti-tumor response.
Methods
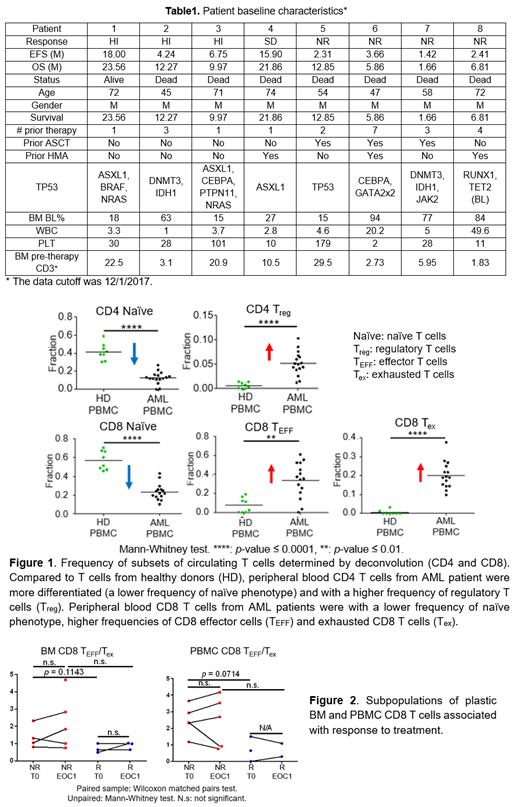
We performed whole transcriptomic profiling (RNA-sequencing, RNA-seq) on T cells from a cohort of AML patients who were enrolled in the clinical trial mentioned above, and treated with azacytidine and nivolumab (Table 1). Sixty-four FACS-sorted patient-derived T cell samples from cryopreserved peripheral blood (PB) or bone marrow (BM) aspirates, which were collected pre-therapy (T0) and after the first round of treatment (end of cycle one, EOC1), were evaluated. By leveraging subset definitions based on scRNA-seq results from T cells of cancer patients, we implemented deconvolution of our bulk T-cell RNA-seq data to obtain the relative abundance of different T-cell subsets (in-silico dissection without physical isolation).
Results
We performed ex vivo cDNA library preparation on 2,000-100,000 sorted T cells and yielded a minimal of 17 million sequencing reads per BM T-cell library and 2.6 million sequencing reads per PBMC T-cell library. We compared the gene expression profile of peripheral blood T cells from AML patients (CD4: n = 16; CD8: n = 15) and healthy donors (HD, n = 8)2,3 to validate our methodology. The deconvolution results were consistent with previously published flow-cytometry data profiling cancer patients4,5 (Figure 1). In comparison with HDs, circulating CD4 T cells from AML patients consisted of a higher frequency of Treg (AML versus HD: 5.1% versus 0.6%, P<0.0001)4. Peripheral blood CD8 T cells from AML patients were with a significantly lower frequency of naïve (AML versus HD: 22.1% versus 55.9%, P<0.0001), a higher frequency of effector phenotype (AML versus HD: 35.6% versus 6.7%, P =0.0011), and an increasing frequency of exhausted phenotype (AML versus HD: 19.1% versus 0.0%, P<0.0001)5.
Independent of the clinical responses attained on the azacytidine and nivolumab, comparison of the pre-therapy CD8 T cells from BM and PB from all AML patients using both gene set enrichment analysis and deconvolution indicated that the BM CD8 T cells were more activated/differentiated compared with PBMC CD8 T cells, likely reflective of an ongoing immune response against the AML. We also found treatment-induced gene expression profile changes in the AML circulating CD8 T cells, characterized by increased cell metabolism and cell proliferation. Deconvolution identified that pre-therapy relative abundance of exhausted (CD3+CD8+PD-1+CD45RO+) and effector (CD3+CD8+CD45RA+Tbet+PD-1lo) CD8 T cells (plasticity) could serve as subpopulations relevant for patient stratification (Figure 2). We further validated these results using CyTOF wherein these same subpopulations were differentially abundant between responders and non-responders at the pre-therapy time-point.
Conclusions
Collectively, the analyses of RNA-seq of CD8 T cells from AML patients on the azacytidine with nivolumab trial revealed that (1) the PD-1 blockade-based treatment-induced gene expression profiling changes (increased cell proliferation and metabolism) of CD8 T cells are detectable as early as EOC1 in the peripheral blood; (2) specific subpopulations of plastic CD8 T cells identified may have the potential to serve as an actionable biomarker to select AML patients most likely to benefit from such immune checkpoint therapies. These findings need to be confirmed in larger studies, planned or currently being conducted, with αPD-1 based therapies in AML and MDS.
References
1. Daver, N. et al.Cancer Discov.9, 370-383 (2019).
2. Corces, M. R. et al.Nat. Genet.48, 1193-1203 (2016).
3. Linsley, P. S. et al. PLoS One9, (2014).
4. Szczepanski, M. J. et al.Clin. Cancer Res.15, 3325-3332 (2009).
5. Knaus, H. A. et al.JCI Insight3, (2018).
Varadarajan:CellChorus: Employment, Equity Ownership.
Author notes
Asterisk with author names denotes non-ASH members.


This feature is available to Subscribers Only
Sign In or Create an Account Close Modal