

Background. MPN are clonal disorders of hematopoietic stem cell (HSC) that include polycythemia vera (PV), essential thrombocytemia (ET) and myelofibrosis (MF), either secondary to ET-PV, or primary (PMF), including pre-fibrotic (pre-PMF) and overt. In MF, multi-lineage dysplasia (MLD) of varying degree can be detected by morphologic analysis of bone marrow (BM), but appraisal of MLD is intrinsically operator-dependent and lacks quantitative information. Multi-parameter flow cytometry (MFC) is used to study dysplasia by investigating aberrant antigen expression profiles during hematopoietic cells' differentiation and maturation, allowing: i) analysis of a much greater cell number; ii) standardization of data by referring to controls; iii) definition of scores to estimate MLD extent.
Aim. The aim of the study was to assess MLD in MPN by MFC and correlate with disease' variant, clinical and biological features.
Methods. Patients: pts were diagnosed according to 2016 WHO criteria. Driver and high molecular risk mutations (HMR) were determined. MFC: Different BM cell compartments were analyzed with a panel of 28 monoclonal antibodies (MoAb) by 2 acquisition steps: Step 1) HSC and progenitor (GMP and MEP) cells up to >5 x 10⁶ cells/sample were studied by Lin/CD34/CD38/CD90/CD45/CD49f/CD45RA/CD135 MoAb. Step 2) Precursor and mature compartments (B-, neutrophilic, monocytic, erythroid, plasmacytoid dendritic cells, basophils) were identified within CD34+ and/or CD117+ subset. Uncommitted CD38+ precursors were obtained by subtraction. CD117-neg, maturing cells were identified by specific features, ie CD34, CD45 and scatter. MLD was assessed by 2 phenotypic scores: i) one validated by ELN in MDS (Ogata score) includes 4 parameters; ii) the second one, adapted from Matarraz et al (2010; Salamanca score), 63 parameters. Normal phenotypic profile was defined as the interval between mean value (M) ± 2SD per parameter in healthy donors' BM samples. Each parameter scored 0.5, 1 or 2 for values between M ± 2 SD and M ± 3 SD, M ± 3 SD and M ± 4 SD, and over M ± 4 SD of the normal profile, respectively.
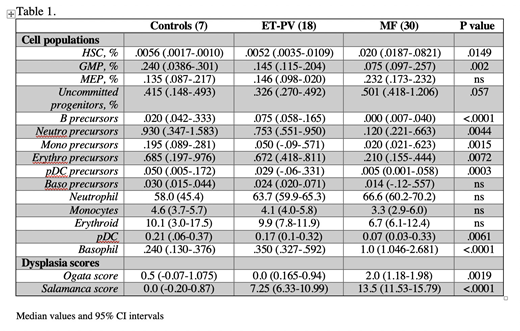
Results. 51 consecutive MPN pts at diagnosis were enrolled, including 30 MF (7 pre-PMF, 14 overt PMF, 9 post-PV/ET MF); 13 ET, 5 PV, 1 MPN-unclassifiable and 2 MDS/MPN. Median age was 59y (range 24-83). 19 (63.3%) MF patients had JAK2V617F, 9 (30.0%) CALR, 2 (6.7%) MPLW515L mutation. 11 pts (36.7%) harbored at least 1 HMR mutation. According to MIPSS, 6 (20.0%), 11 (36.7%) and 10 (33.3%) were low, intermediate and high risk. By comparing MF pts to controls and ET-PV, altered proportion of immature cell subsets was observed. Specifically, HSC and uncommitted progenitors in MF were increased of 3.8 and 1.5-fold, respectively whereas GMP and downstream precursors were significantly reduced 2 to >6-fold. No significant differences emerged comparing mature compartments, except for an increase of basophils and a decrease of pDC in MF subset (Table 1). When considering MLD, MF patients ranked higher scores for both the Ogata and Salamanca score. Furthermore, Salamanca score values had a trend to correlate with MIPSS risk categories, with median value of 7.75, 13.25 and 15.5 in low, intermediate and high category (KW test P=0.06). MF cases were separated according to Salamanca score ≥ or < to the median value of 13.5: pts with higher score were featured by significant differences in hemoglobin (11.9 vs 13.7 g/dL; P=.015), platelet count (330 vs 558 x109/L; P=.004), LDH (380 vs 275 U/L; P=.034), circulating CD34+ cells (60.4 vs 5.3/mL; P=.007). We also compared prePMF and ET pts, two categories with challenging differential diagnosis: prePMF displayed expansion of HSC (0.015) compared to ET (0.0056; P=0.028) and reduced proportions of downstream precursors, similar to what observed in MF vs non-MF comparison. Conversely, MLD scores were similar: Ogata 1.0 vs 1.0, Salamanca 9.0 vs 7.5 for ET and prePMF, respectively.
Conclusions. The assessment of MLD by MFC correlated with MPN variants according to WHO; MF was associated with higher deviation from normal phenotypic profile. MLD scores delineated clinical phenotype and were consistent with MIPSS risk stratification. With the limits of number of pts analyzed, these preliminary data also support a biologic continuum of pre-PMF and MF, the first being characterized by abnormal expansion of immature cell compartments compared to ET but minimal signs of dysplastic maturation unlike overt MF.
Vannucchi:Novartis: Membership on an entity's Board of Directors or advisory committees, Speakers Bureau; Incyte: Membership on an entity's Board of Directors or advisory committees; Celgene: Membership on an entity's Board of Directors or advisory committees; Italfarmaco: Membership on an entity's Board of Directors or advisory committees; CTI BioPharma: Membership on an entity's Board of Directors or advisory committees, Speakers Bureau.

This feature is available to Subscribers Only
Sign In or Create an Account Close Modal