Key Points
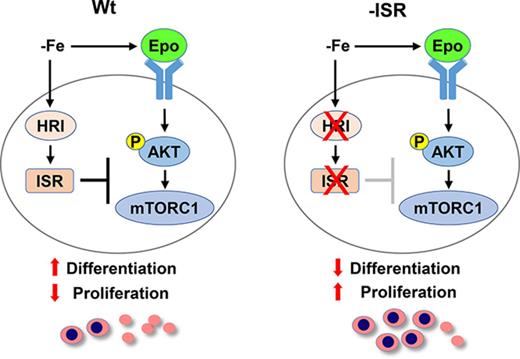
Erythroid eIF2αP and ATF4 are essential for iron-restricted erythropoiesis, and HRI-eIF2αP is responsible for microcytic hypochromic anemia.
HRI activates integrated stress response and represses mTORC1 signaling in ID to mitigate ineffective erythropoiesis.
Abstract
Iron deficiency (ID) anemia is a prevalent disease, yet molecular mechanisms by which iron and heme regulate erythropoiesis are not completely understood. Heme-regulated eIF2α kinase (HRI) is a key hemoprotein in erythroid precursors that sense intracellular heme concentrations to balance globin synthesis with the amount of heme available for hemoglobin production. HRI is activated by heme deficiency and oxidative stress, and it phosphorylates eIF2α (eIF2αP), which inhibits the translation of globin messenger RNAs (mRNAs) and selectively enhances the translation of activating transcription factor 4 (ATF4) mRNA to induce stress response genes. Here, we generated a novel mouse model (eAA) with the erythroid-specific ablation of eIF2αP and demonstrated that eIF2αP is required for induction of ATF4 protein synthesis in vivo in erythroid cells during ID. We show for the first time that both eIF2αP and ATF4 are necessary to promote erythroid differentiation and to reduce oxidative stress in vivo during ID. Furthermore, the HRI-eIF2αP-ATF4 pathway suppresses mTORC1 signaling specifically in the erythroid lineage. Pharmacologic inhibition of mTORC1 significantly increased red blood cell counts and hemoglobin content in the blood, improved erythroid differentiation, and reduced splenomegaly of iron-deficient Hri−/− and eAA mice. However, globin inclusions and elevated oxidative stress remained, demonstrating the essential nonredundant role of HRI-eIF2αP in these processes. Dietary iron repletion completely reversed ID anemia and ineffective erythropoiesis of Hri−/−, eAA, and Atf4−/− mice by inhibiting both HRI and mTORC1 signaling. Thus, HRI coordinates 2 key translation-regulation pathways, eIF2αP and mTORC1, to circumvent ineffective erythropoiesis, highlighting heme and translation in the regulation of erythropoiesis.
Introduction
Iron deficiency (ID) anemia is a very common affliction worldwide and is a major contributor to the global burden of anemia.1 However, the molecular mechanisms by which iron and heme regulate erythropoiesis are still not well understood. Most of the iron in the human body is bound in heme where its inclusion in hemoglobin accounts for as much as 70% of the total iron content.2 Heme-regulated eIF2α kinase (HRI) stands out as a unique heme-sensing protein with 2 heme-binding domains3-5 and is expressed predominantly in the erythroid lineage.6 Heme, in addition to serving as a prosthetic group for hemoglobin, also acts as a signaling molecule by modulating HRI activity.7-9
HRI is activated in heme deficiency and phosphorylates eIF2α, impairing further rounds of initiation and thereby inhibiting translation.8,10 During erythroid differentiation, HRI coordinates translation of globin messenger RNAs (mRNAs) with the availability of heme for the production of large amounts of hemoglobin in erythroid precursors.11 In HRI deficiency, excess globins synthesized during heme deficiency precipitate and cause proteotoxicity.12,13 Beyond regulation of globin translation, HRI also reduces ineffective erythropoiesis (IE) during ID and in β-thalassemia.12,13 IE that occurs in Hri−/− mice during ID and in β-thalassemic mice is primarily the result of the profound inhibition of erythroid differentiation starting at the basophilic erythroblast stage.14,15 Apart from inhibiting protein synthesis of highly translated mRNAs, phosphorylated eIF2α (eIF2αP) also selectively enhances translation of certain poorly translated mRNAs, most notably activating transcription factor 4 (ATF4) mRNA, for adaptation to various stresses.10,16 This coordinated translational regulation is called integrated stress response (ISR). HRI activates this eIF2αP-ATF4 ISR pathway in primary erythroblasts for adaptation to oxidative stress.14,17
Erythropoiesis under anemic stress is accelerated by elevated erythropoietin (Epo) levels in response to the hypoxia experienced from anemia.18 One of the Epo responsive pathways is the PI3 kinase/AKT signaling and the downstream mechanistic target of rapamycin complex 1 (mTORC1) in erythroid precursors.19 mTORC1 signaling increases protein synthesis by phosphorylating eIF4E binding protein 1 (4EBP1) and ribosomal protein S6 kinase (S6K), which phosphorylates S6.20
To further interrogate the molecular mechanism of HRI-eIF2αP-ATF4 signaling in iron-restricted erythropoiesis, we generated a novel mouse model (eAA) that lacks eIF2αP specifically in the erythroid lineage. We report here that eIF2αP and ATF4 are both necessary to mitigate oxidative stress and IE during ID. We further show that mTORC1 activities are elevated in erythroid precursors from mutant mice defective in HRI signaling. Our results demonstrate that HRI-ISR mitigates IE during ID through translation regulation mediated by both eIF2αP and mTORC1 signaling.
Methods
Animals
Mice were maintained at the Massachusetts Institute of Technology animal facility, and all experiments were carried out by using protocols approved by the Division of Comparative Medicine. Hri−/− and Atf4−/− mice were as described previously.12,21 eAA mice were generated by crossing A/ATg mice22,23 with EpoR–GFPcre mice.24 All mice used for this study were of C57BL/6J genetic background. Diet-induced ID was as described previously12 (details are available in supplemental Methods, available on the Blood Web site). Both male and female mice were used.
Hematologic analysis, globin inclusions, and serum Epo
Complete blood cell analysis and globin precipitates assay by sodium dodecyl sulfate polyacrylamide gel electrophoresis were as described.12 Serum Epo levels were measured by using Mouse Erythropoietin Quantikine ELISA Kit (R&D Systems, Inc.).
Isolation of primary erythroid precursors and western blot analysis
Bone marrow (BM) and spleen cells were labeled with non-erythroid lineage biotinylated antibodies (supplemental Table 1) and streptavidin MicroBeads. Erythroid and non-erythroid cells were isolated by using MACS Column Technology (Miltenyi Biotech). Cell lysates were prepared using radioimmunoprecipitation assay buffer or cell lysis buffer (Cell Signaling Technology). Proteins from equal numbers of nucleated cells were separated by 4% to 15% sodium dodecyl sulfate polyacrylamide gel electrophoresis. Antibodies used are described in supplemental Table 2. Quantification of western blots was performed by using ImageJ (National Institutes of Health).
Erythroid differentiation and ROS measurement
Erythroid differentiation and reactive oxygen species (ROS) levels from BM and spleen were measured by flow cytometry as described.14 Reticulocytes in blood samples were measured by MitoTracker Deep Red FM as described.25 Flow cytometry was carried out on a FACS LSR II flow cytometer (BD Biosciences) and analyzed with FlowJo (Tree Star, Ashland, OR). Reagents used for flow cytometry are described in supplemental Table 1.
Drug treatments and in vivo protein synthesis
Mice were intraperitoneally injected once per day with rapamycin (5 mg/kg) or INK128 (2 mg/kg) (LC Laboratories) in a 200 μL solution of phosphate-buffered saline with 5% polyethylene glycol 400 plus 5% polysorbate 80. Protein synthesis in vivo was measured by incorporating puromycin into nascent polypeptides, which were measured by western blot analysis using anti-puromycin antibody (details provided in supplemental Methods). Puromycin (Sigma-Aldrich) was injected intraperitoneally at 21.78 mg/kg in phosphate-buffered saline 30 minutes before mice were euthanized .
Statistical analysis
Independent Student t test was used to analyze the experimental data. Data were presented in mean ± standard error. P < .05 was considered statistically significant.
Results
Generation of mice with defective eIF2αP signaling in the erythroid lineage
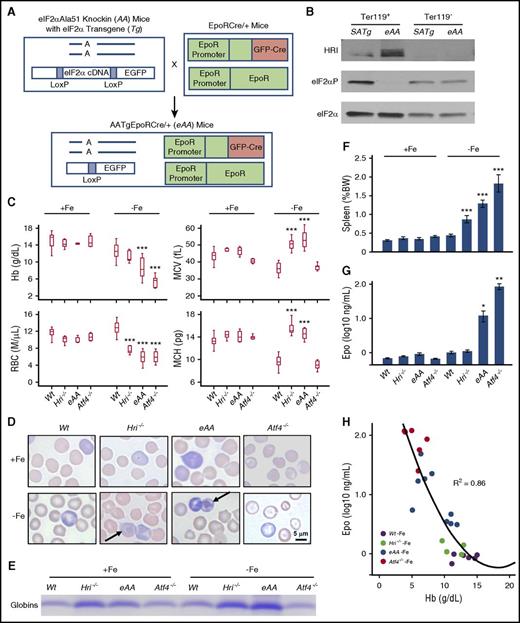
To better define the role of eIF2αP in HRI-eIF2αP-ATF4 signaling during erythropoiesis, we generated a novel erythroid-specific eIF2α Ala51 knockin mouse model (eAA) that has a substitution of the phosphorylation site Ser51 with Ala as outlined in Figure 1A. The universal eIF2αAla51/Ala51 (AA) knockin mice die shortly after birth.26 To rescue the neonatal lethality, a constitutively expressed eIF2α transgene (Tg) flanked by LoxP sites was introduced to generate AATg mice.23 Erythroid-specific deletion of the eIF2αTg was achieved by using EpoRGFPCre+mice24 to create AATgEpoRCre+ (eAA) mice. eAA mice were born in near normal Mendelian ratio with poor fertility.
Characterization of erythroid phenotypes of eAA and Atf4−/−mice in ID. (A) Generation of eAA mice by crossing AATg mice with EpoRCre+ mice. (B) Defective eIF2αP in Ter119+ cells of eAA mice. Sorted Ter119+ erythroblasts (populations I+II) and Ter119– (supplemental Figure 1A-B) from BM were used. (C) Complete blood cell count (CBC) of Wt, Hri−/−, eAA, and Atf4−/− mice under both +Fe and –Fe conditions. (D) Wright-Giemsa stained blood smears. Arrows indicate globin inclusions. Photographs were taken by using a Leitz optical microscope with PixeLINK Capture software. (E) Sodium dodecyl sulfate polyacrylamide gel electrophoresis (SDS-PAGE) assay of insoluble globin precipitates from blood samples. Precipitated globin protein in 2000g pellets of equal numbers of blood cells (1 × 10⁷) were analyzed. (F) Spleen weights as percentage of body weights. (G) Serum Epo levels. (H) Correlation of serum Epo to hemoglobin levels. P values denote the comparison between Wt and mutant mice under –Fe conditions. *P < .05, **P < .01, ***P < .001. Numbers of mice used in (C and F): Wt+Fe, n = 25; Hri−/−+Fe, n = 5; eAA+Fe, n = 6; Atf4−/−+Fe, n = 11; Wt–Fe, n = 22; Hri−/−–Fe, n = 6; eAA–Fe, n = 11; Atf4−/−–Fe, n = 10. Numbers of mice used in (G): Wt+Fe, n = 11; Hri−/−+Fe, n = 8; eAA+Fe, n = 5; Atf4−/−+Fe, n = 4; Wt–Fe, n = 9; Hri−/−–Fe, n = 9; eAA–Fe, n = 10; Atf4−/−–Fe, n = 6. Numbers of mice used in (H): Wt–Fe, n = 6; Hri−/−–Fe, n = 6; eAA–Fe, n = 10; Atf4−/−–Fe, n = 6. BW, body weight; MCH, mean corpuscular hemoglobin; MCV, mean corpuscular volume.
Characterization of erythroid phenotypes of eAA and Atf4−/−mice in ID. (A) Generation of eAA mice by crossing AATg mice with EpoRCre+ mice. (B) Defective eIF2αP in Ter119+ cells of eAA mice. Sorted Ter119+ erythroblasts (populations I+II) and Ter119– (supplemental Figure 1A-B) from BM were used. (C) Complete blood cell count (CBC) of Wt, Hri−/−, eAA, and Atf4−/− mice under both +Fe and –Fe conditions. (D) Wright-Giemsa stained blood smears. Arrows indicate globin inclusions. Photographs were taken by using a Leitz optical microscope with PixeLINK Capture software. (E) Sodium dodecyl sulfate polyacrylamide gel electrophoresis (SDS-PAGE) assay of insoluble globin precipitates from blood samples. Precipitated globin protein in 2000g pellets of equal numbers of blood cells (1 × 10⁷) were analyzed. (F) Spleen weights as percentage of body weights. (G) Serum Epo levels. (H) Correlation of serum Epo to hemoglobin levels. P values denote the comparison between Wt and mutant mice under –Fe conditions. *P < .05, **P < .01, ***P < .001. Numbers of mice used in (C and F): Wt+Fe, n = 25; Hri−/−+Fe, n = 5; eAA+Fe, n = 6; Atf4−/−+Fe, n = 11; Wt–Fe, n = 22; Hri−/−–Fe, n = 6; eAA–Fe, n = 11; Atf4−/−–Fe, n = 10. Numbers of mice used in (G): Wt+Fe, n = 11; Hri−/−+Fe, n = 8; eAA+Fe, n = 5; Atf4−/−+Fe, n = 4; Wt–Fe, n = 9; Hri−/−–Fe, n = 9; eAA–Fe, n = 10; Atf4−/−–Fe, n = 6. Numbers of mice used in (H): Wt–Fe, n = 6; Hri−/−–Fe, n = 6; eAA–Fe, n = 10; Atf4−/−–Fe, n = 6. BW, body weight; MCH, mean corpuscular hemoglobin; MCV, mean corpuscular volume.
The excision of eIF2αTg in the erythroid cells was examined in sorted Ter119+ erythroblasts and Ter119– cells from the BM of littermates eAA and SATg, which had 1 copy of Wt eIF2α. Regardless of the activation of HRI, eIF2αP was greatly reduced specifically in Ter119+ cells from eAA BM compared with those from SATg BM (Figure 1B). Additional characterization of eAA mice using green fluorescent protein (GFP) is shown in supplemental Figure 1. Together, these results validate the generation of a novel eAA mouse model with defective eIF2αP exclusively in the erythroid lineage.
Severe anemia and IE of iron-deficient eAA and Atf4−/− mice
Both eAA and Atf4−/− mice were used to investigate HRI-ISR during erythropoiesis. In iron-sufficient conditions (+Fe), eAA and Atf4−/− mice did not exhibit significant erythroid abnormality. After 8 weeks in ID (–Fe), eAA and Atf4−/− mice were more anemic with lower blood hemoglobin (Hb) levels than Wt and Hri−/− mice (Figure 1C). Similar to Hri−/− mice, eAA and Atf4−/− mice also had reduced red blood cell (RBC) numbers. eAA mice developed macrocytic hyperchromic anemia in ID as did Hri−/− mice.12 In contrast, Atf4−/− mice, which have HRI and eIF2αP, displayed microcytic hypochromic anemia as did Wt mice. These results demonstrate that eIF2αP, but not ATF4, is required for microcytic hypochromic anemia. Insoluble globin inclusions were visible in eAA blood smears and cell lysates, but not Atf4−/− (Figure 1D-E), consistent with the function of eIF2αP in translation.
Both eAA and Atf4−/− mice developed splenomegaly in ID similar to that in Hri−/− mice (Figure 1F). Serum Epo levels increased significantly in all mice under ID (Figure 1G). Importantly, serum Epo levels correlated inversely with blood Hb levels (Figure 1H). Thus, higher Epo levels in Hri−/−, eAA, and Atf4−/− mice in ID are the result of more severe anemia in these mice.
Activation of HRI-eIF2αP-ATF4 signaling in vivo during ID
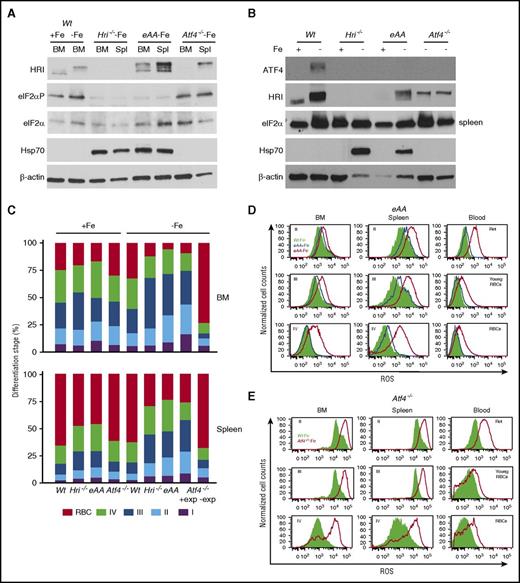
HRI was activated in Wt–Fe BM as shown by the upshift of phosphorylated HRI compared with Wt+Fe (Figure 2A). Interestingly, eAA–Fe and Atf4−/−–Fe erythroid precursors exhibited a higher degree of HRI autophosphorylation than Wt. Furthermore, eIF2αP levels were higher in Wt and Atf4−/− than in Hri−/− and eAA mice. Importantly, ATF4 protein was also increased in the erythroid cells from the spleen (Figure 2B) but not from the BM (supplemental Figure 2A) of the Wt–Fe mice, in agreement with the spleen as a major organ for stress erythropoiesis. However, no ATF4 protein was detected in Hri−/− and eAA mice, demonstrating that HRI and eIF2αP are necessary for ATF4 induction in vivo during ID.
HRI-ISR is activated in ID and is necessary to promote differentiation and mitigate ROS. (A) HRI-eIF2αP signaling and (B) ATF4 expression in erythroid precursors from Wt, Hri−/−, eAA, and Atf4−/− mice. (C) Differentiation stages of Ter119+ cells from BM and spleen (Spl). +exp and –exp denote with or without splenic erythroid expansion, respectively, of Atf4−/−–Fe mice (supplemental Figure 2C-E). (D-E) Representative ROS histograms for Ter119+ populations from eAA and Atf4−/− mice. Wt–Fe (green shade), eAA+Fe (blue line), eAA–Fe (red line), and Atf4−/−–Fe (red line) in BM, spleen, and blood samples. Numbers of mice used in (C): Wt+Fe, n = 34; Hri−/−+Fe, n = 8; eAA+Fe, n = 6; Atf4−/−+Fe, n = 4; Wt–Fe, n = 31; Hri−/−–Fe, n = 9; eAA–Fe, n = 11; Atf4−/−–Fe +exp, n = 5; Atf4−/−–Fe, –exp, n = 5. Ret, reticulocyte.
HRI-ISR is activated in ID and is necessary to promote differentiation and mitigate ROS. (A) HRI-eIF2αP signaling and (B) ATF4 expression in erythroid precursors from Wt, Hri−/−, eAA, and Atf4−/− mice. (C) Differentiation stages of Ter119+ cells from BM and spleen (Spl). +exp and –exp denote with or without splenic erythroid expansion, respectively, of Atf4−/−–Fe mice (supplemental Figure 2C-E). (D-E) Representative ROS histograms for Ter119+ populations from eAA and Atf4−/− mice. Wt–Fe (green shade), eAA+Fe (blue line), eAA–Fe (red line), and Atf4−/−–Fe (red line) in BM, spleen, and blood samples. Numbers of mice used in (C): Wt+Fe, n = 34; Hri−/−+Fe, n = 8; eAA+Fe, n = 6; Atf4−/−+Fe, n = 4; Wt–Fe, n = 31; Hri−/−–Fe, n = 9; eAA–Fe, n = 11; Atf4−/−–Fe +exp, n = 5; Atf4−/−–Fe, –exp, n = 5. Ret, reticulocyte.
In contrast to endoplasmic reticulum stress, inductions of the cytoplasmic chaperone Hsp70 protein (Figure 2A-B) and mRNA (supplemental Figure 2B) were not observed in Wt–Fe erythroid precursors. Rather, Hsp70 protein expression was highly enhanced in erythroid precursors from iron-deficient, but not iron-sufficient, Hri−/− and eAA mice compared with Wt mice (Figure 2A-B), correlating with the presence of globin inclusions (Figure 1D-E). Thus, inhibition of globin mRNA translation by HRI-eIF2αP is essential for reducing proteotoxicity from cytoplasmic unfolded heme-free globins during ID.
ATF4 and eIF2αP are necessary for erythroid differentiation and ROS reduction
Contributions of eIF2αP and ATF4 to erythroid differentiation in vivo were measured by flow cytometry,27 as shown in supplemental Figure 2C-D. In +Fe, differentiation was similar between mutant and Wt mice in the BM, and a mild erythroid expansion was observed in the spleens of Hri−/− and eAA mice (Figure 2C). eAA–Fe mice exhibited inhibition of differentiation similar to that in Hri−/−–Fe mice, starting at the basophilic erythroblast stage (I+II) with accumulations of polychromatic erythroblasts (III). Although most of the Atf4−/− mice died neonatally,21 the few surviving mice displayed normal steady-state erythropoiesis (Figure 2C). During ID, half the Atf4−/−–Fe mice exhibited splenic erythroid expansion (+exp) with inhibition of differentiation similar to that in Hri−/− and eAA mice. Atf4−/− mice without erythroid expansion (–exp) had an earlier block in differentiation with fewer erythroblasts and reticulocytes in the spleen and few Ter119+ cells in the BM (Figure 2C; supplemental Figure 2E). These results demonstrate that late erythroblasts (II+III), are the populations undergoing expansion during ID of Hri−/−, eAA, and Atf4−/− mice. Increased reticulocyte percentages in blood samples were observed in mutant mice (supplemental Figure 2F).
Similar to erythroid cells in Hri−/− mice (Suragani et al14 ; supplemental Figure 2G), eAA and Atf4−/− erythroid cells also exhibited significant increases in ROS levels in the BM, spleen, and blood, especially late erythroblasts (III+IV), reticulocytes, and RBCs (Figure 2D-E) during ID. Atf4−/−–Fe erythroblasts and RBCs exhibited elevated ROS regardless of the status of splenic erythroid expansion (supplemental Figure 2H). Together, these results demonstrate for the first time that both erythroid eIF2αP and ATF4 are necessary to promote differentiation and to reduce oxidative stress in erythroid cells during ID.
Rapamycin inhibits mTORC1 signaling and attenuates IE in Hri−/−–Fe and eAA–Fe mice
Recently, it has been reported that mTORC1 signaling in blood cells is inhibited under ID.28 We investigated whether HRI signaling was necessary for repression of mTORC1 activity in ID. Blood and splenic erythroid cells from mutant mice had elevated pS6 and S6 compared with those from Wt mice during ID (supplemental Figure 3A). These results demonstrate that HRI-eIF2αP-ATF4 signaling is necessary for repression of mTORC1, especially the pS6 signaling in the splenic erythroid cells during ID.
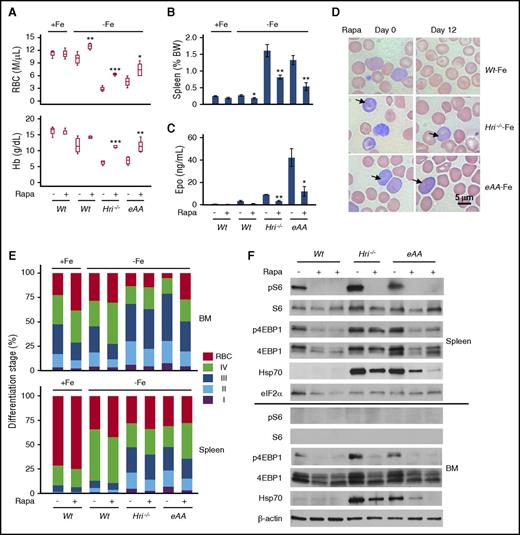
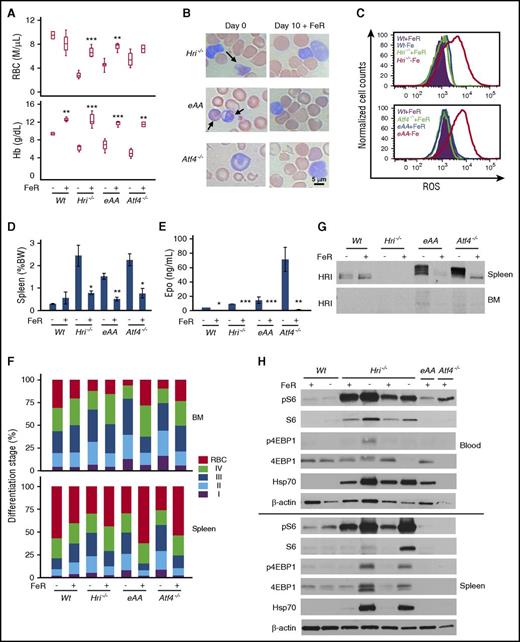
To determine the role of increased mTORC1 activity in the erythroid expansion and IE of Hri−/− and eAA mice in ID, the mice were treated with rapamycin, an mTORC1 inhibitor. After 12 once-per-day treatments, rapamycin did not alter the RBC numbers or Hb levels in Wt+Fe mice, but RBC numbers were significantly increased in Wt–Fe mice (Figure 3A). Importantly, rapamycin greatly increased RBC numbers and Hb levels in Hri−/−–Fe and eAA–Fe mice. Although it was difficult to produce a sufficient number of Atf4−/− mice for statistical analysis, rapamycin also significantly increased RBC numbers in 3 Atf4−/−–Fe mice as was evident from examination of blood smears prepared before and after rapamycin treatment (supplemental Figure 3B). Furthermore, rapamycin significantly reduced the splenomegaly and Epo levels in both Hri−/− and eAA mice (Figure 3B-C). Importantly, histologic analysis of spleen sections revealed that rapamycin reduced the density of red pulps of Hri−/−–Fe and eAA–Fe mice (supplemental Figure 3C). These data demonstrate that rapamycin reduces IE of Hri−/− and eAA mice even when iron is limiting.
Suppression of elevated mTORC1 activity by rapamycin attenuates IE of iron-deficient Hri−/−, eAA, and Atf4−/−mice. (A) CBC analysis of blood samples after 12 days of vehicle or rapamycin (Rapa) treatments. (B) Spleen weights as percentage of body weight. (C) Serum Epo levels. P values denote the comparison between vehicle and rapamycin treatment of each genotype. *P < .05, **P < .01, ***P < .001. (D) Representative blood smears before (day 0) and after 12 days (day 12) of rapamycin treatments. Arrows indicate globin inclusions. (E) Erythroid differentiation of BM and spleen. (F) mTORC1 activity in total BM and spleen cells. Numbers of mice used in (A-C and E), +Fe conditions: Wt, n = 3; Wt+rapa, n = 3; –Fe conditions: Wt, n = 5; Wt+rapa, n = 4; Hri−/−, n = 4; Hri−/−+rapa, n = 5; eAA, n = 4; eAA+rapa, n = 5.
Suppression of elevated mTORC1 activity by rapamycin attenuates IE of iron-deficient Hri−/−, eAA, and Atf4−/−mice. (A) CBC analysis of blood samples after 12 days of vehicle or rapamycin (Rapa) treatments. (B) Spleen weights as percentage of body weight. (C) Serum Epo levels. P values denote the comparison between vehicle and rapamycin treatment of each genotype. *P < .05, **P < .01, ***P < .001. (D) Representative blood smears before (day 0) and after 12 days (day 12) of rapamycin treatments. Arrows indicate globin inclusions. (E) Erythroid differentiation of BM and spleen. (F) mTORC1 activity in total BM and spleen cells. Numbers of mice used in (A-C and E), +Fe conditions: Wt, n = 3; Wt+rapa, n = 3; –Fe conditions: Wt, n = 5; Wt+rapa, n = 4; Hri−/−, n = 4; Hri−/−+rapa, n = 5; eAA, n = 4; eAA+rapa, n = 5.
Although rapamycin reduced the percentage of blood reticulocytes (supplemental Figure 3D), reticulocytes of Hri−/−–Fe and eAA–Fe mice still displayed visible globin inclusions (Figure 3D), demonstrating an essential role of HRI-eIF2αP in inhibiting globin translation. Furthermore, ROS levels in RBCs of Hri−/− and eAA mice were not significantly altered by rapamycin (supplemental Figure 3E), indicating that mTORC1 signaling is not involved in reducing oxidative stress in ID.
Rapamycin also promoted erythroid differentiation in both the BM and spleen of Hri−/− and eAA mice, as shown by a significant decreased percentage of early erythroblasts (I+II+III) and increased percentage of orthochromatic erythroblasts and reticulocytes (IV) and RBCs (Figure 3E). No significant change was observed in numbers of nucleated cells in BM, apoptosis, or viability of erythroid cells in all mice after rapamycin treatment (data not shown). All together, these results demonstrate that rapamycin promotes erythroid differentiation without affecting viability and apoptosis.
Rapamycin also dramatically diminished pS6 and S6 levels in spleens of Wt–Fe, Hri−/−–Fe, and eAA–Fe mice. Furthermore, p4EBP1 was greatly decreased in the BM and spleens of mice by rapamycin (Figure 3F), validating inhibition of mTORC1. Interestingly, Hsp70 elevated in Hri−/− and eAA cells was also reduced by rapamycin.
INK128 reduces IE of Hri−/−–Fe mice
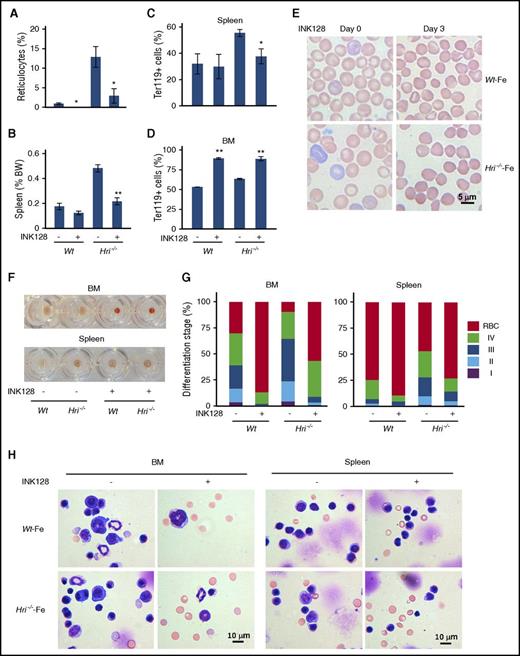
To further support the role of mTORC1 signaling in the development of IE in Hri−/− mice during ID, an adenosine triphosphate competitive and more potent mTORC1 inhibitor, INK128, was used. After 3 once-per-day INK128 treatments, blood reticulocyte percentages were significantly decreased (Figure 4A,E; supplemental Figure 4). There was a significant reduction of both splenomegaly and percentage of Ter119+ cells in the spleen of INK128-treated Hri−/− mice (Figure 4B-C). Together, these results demonstrate that INK128 treatment can ameliorate the IE in Hri−/−–Fe mice. Strikingly, INK128 increased Ter119+ erythroid cells in the BM of both Wt–Fe and Hri−/−–Fe mice to nearly 90% (Figure 4D), which was also evident from the enhanced red coloration of the BM cell pellets from INK128-treated mice (Figure 4F). In addition, INK128 greatly promoted erythroid differentiation in both the BM and spleen of Wt and Hri−/− mice (Figure 4G). This was confirmed by the BM and spleen cell morphology (Figure 4H). The apoptosis of erythroid precursors and viability of all erythroid cells were not altered after INK128 treatment (data not shown). These data demonstrate that INK128 promotes erythroid differentiation to attenuate IE and improve anemia of Hri−/− mice without affecting apoptosis or cell viability.
INK128 reduces IE of Hri−/−–Fe mice. (A) Reticulocyte percentage in blood samples and (B) spleen weights of Wt–Fe and Hri−/−–Fe mice treated with vehicle or INK128 for 3 days. (C-D) Percentages of Ter119+ cells in spleens and BM. P values denote the difference between vehicle and INK128 treatment of each genotype. *P < .05, **P < .01. (E) Representative Wright-Giemsa stained blood smears before (day 0) and after 3 days (day 3) of INK128 treatment. (F) Representative cell pellets of BM and spleen samples. (G) Erythroid differentiation of BM and spleen. (H) Representative cell morphology of BM and spleen samples stained with May-Grunwald-Giemsa. Three mice were used for each condition and genotype.
INK128 reduces IE of Hri−/−–Fe mice. (A) Reticulocyte percentage in blood samples and (B) spleen weights of Wt–Fe and Hri−/−–Fe mice treated with vehicle or INK128 for 3 days. (C-D) Percentages of Ter119+ cells in spleens and BM. P values denote the difference between vehicle and INK128 treatment of each genotype. *P < .05, **P < .01. (E) Representative Wright-Giemsa stained blood smears before (day 0) and after 3 days (day 3) of INK128 treatment. (F) Representative cell pellets of BM and spleen samples. (G) Erythroid differentiation of BM and spleen. (H) Representative cell morphology of BM and spleen samples stained with May-Grunwald-Giemsa. Three mice were used for each condition and genotype.
Iron repletion restores anemia and inhibits both HRI and mTORC1 signaling
We then investigated whether IE developed in Hri−/−, eAA, and Atf4−/− mice in ID could be reversed upon dietary iron repletion (FeR). Blood RBC numbers and Hb levels of Hri−/−, eAA, and Atf4−/− mice reached levels similar to those in Wt mice at 10 days after FeR (Figure 5A). Globin inclusions in reticulocytes of Hri−/− and eAA blood were no longer visible, and the RBC morphology of Atf4−/− was improved (Figure 5B). Oxidative stress of reticulocytes in iron-deficient Hri−/−, eAA, and Atf4−/− blood samples was also relieved upon FeR with normal ROS levels (Figure 5C). Splenomegaly and serum Epo levels of mutant mice were greatly reduced upon FeR (Figure 5D-E). FeR also promoted erythroid differentiation in BM and spleen of mutant mice releasing the inhibition of differentiation incurred during ID (Figure 5F). This enhanced differentiation was also evident from the burst of blood reticulocyte percentage at day 2 after FeR of Hri−/−, eAA, and Atf4−/− mice and returned to low levels at day 10 (supplemental Figure 5). In contrast, there were increases in erythroblast (I+II+III) percentages in the BM and spleen of Wt–Fe mice because erythropoiesis was enhanced upon FeR (Figure 5F).
Iron repletion restores anemia and erythroid differentiation by attenuating HRI and mTORC1 signaling in iron-deficient mice. (A) RBC numbers and Hb levels in blood samples of iron-deficient (–FeR) and iron-replete (+FeR) mice. Mice were in ID for 16 to 20 weeks before FeR. (B) Representative Wright-Giemsa stained blood smears on day 0 and day 10 +FeR. Arrows indicate globin inclusions. (C) Representative histograms of ROS levels in reticulocytes of blood samples. (D) Spleen weights as percentage of body weight (BW). (E) Serum Epo levels. (F) Erythroid differentiation of BM and spleen samples. (G) Inactivation of HRI upon FeR in total spleen cells. (H) Downregulation of mTORC1 signaling upon FeR in spleen and blood cells. P values denote the difference between with and without FeR of each genotype. *P < .05, **P < .01, ***P < .001. Numbers of mice used: Wt–FeR, n = 3; Wt+FeR, n = 3; Hri−/−–FeR, n = 4; Hri−/−+FeR, n = 5; eAA–FeR, n = 5; eAA+FeR, n = 4; Atf4−/−–FeR, n = 5; Atf4−/−+FeR, n = 2.
Iron repletion restores anemia and erythroid differentiation by attenuating HRI and mTORC1 signaling in iron-deficient mice. (A) RBC numbers and Hb levels in blood samples of iron-deficient (–FeR) and iron-replete (+FeR) mice. Mice were in ID for 16 to 20 weeks before FeR. (B) Representative Wright-Giemsa stained blood smears on day 0 and day 10 +FeR. Arrows indicate globin inclusions. (C) Representative histograms of ROS levels in reticulocytes of blood samples. (D) Spleen weights as percentage of body weight (BW). (E) Serum Epo levels. (F) Erythroid differentiation of BM and spleen samples. (G) Inactivation of HRI upon FeR in total spleen cells. (H) Downregulation of mTORC1 signaling upon FeR in spleen and blood cells. P values denote the difference between with and without FeR of each genotype. *P < .05, **P < .01, ***P < .001. Numbers of mice used: Wt–FeR, n = 3; Wt+FeR, n = 3; Hri−/−–FeR, n = 4; Hri−/−+FeR, n = 5; eAA–FeR, n = 5; eAA+FeR, n = 4; Atf4−/−–FeR, n = 5; Atf4−/−+FeR, n = 2.
Most importantly, HRI hyperphosphorylation and HRI expression in the spleens of eAA and Atf4−/− mice were greatly reduced upon FeR, demonstrating the inactivation of HRI (Figure 5G). Furthermore, pS6 and p4EBP1 were much reduced in the blood and spleen samples of Hri−/−, eAA, and Atf4−/− mice (Figure 5H). Consistent with reduction of globin inclusions upon FeR (Figure 5B), Hsp70 was greatly diminished in blood and spleen samples from Hri−/− and eAA mice (Figure 5H). Our results demonstrate that FeR readily reverses IE and the elevated mTORC1 signaling observed in mutant mice that have defective HRI-ISR signaling.
INK128 inhibits mTORC1 activity, protein synthesis, and cyclin D3 in vivo
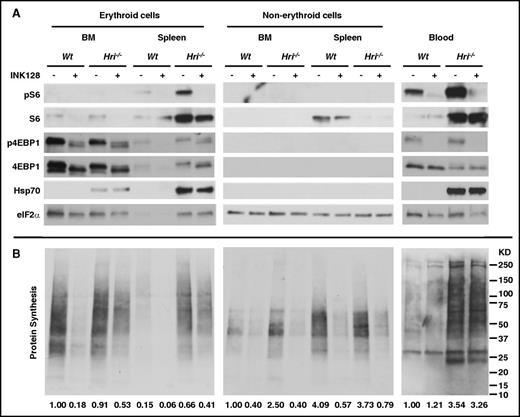
To further investigate the molecular mechanism by which mTORC1 signaling affects erythroid differentiation, Wt–Fe and Hri−/−–Fe mice were treated with INK128 for 6 hours. Inhibitions of mTORC1 signaling and protein synthesis in total spleen and BM cells by INK128 are shown in supplemental Figure 6A. Because HRI is highly expressed in the erythroid lineage, we further examined the mTORC1 activity and protein synthesis separately in the erythroid and non-erythroid cells from BM and spleen of Wt and Hri−/− mice after treatment with vehicle or INK128. As shown in Figure 6A, pS6 and S6 levels were higher in Hri−/−–Fe erythroid cells from spleen and blood. Most significantly, pS6 from non-erythroid cells was not detectable in either the spleen or BM of Hri−/− mice, demonstrating that mTORC1 signaling was elevated specifically in the erythroid lineage of Hri−/−–Fe mice. Similarly, p4EBP1 levels were also elevated in splenic erythroid cells and blood cells of Hri−/−–Fe mice. Total 4EBP1 levels in the BM and spleen were much lower in the non-erythroid cells compared with erythroid cells. Importantly, elevated pS6 and p4EBP1 were inhibited after INK128 treatment (Figure 6A). Elevated Hsp70, which was observed only in Hri−/−–Fe erythroid cells from BM and spleen, was not affected by 6 hours of INK128 treatment.
Inhibition of mTORC1 activity and protein synthesis in vivo by INK128. (A) mTORC1 activities measured by pS6 and p4EBP1 levels and (B) in vivo protein synthesis in the erythroid and non-erythroid cells in BM, spleen, and blood samples. Both Wt–Fe and Hri−/−–Fe mice were treated with vehicle or INK128 for 6 hours. Equal numbers of nucleated cells from BM and spleen were loaded, and the exposure time for developing the western blot was the same for BM and spleen. For blood samples, equal volumes of packed cells were loaded. For measurement of in vivo protein synthesis, the entire nitrocellulose membrane was incubated with anti-puromycin antibody. Puromycin signals from the entire lane of western blots demonstrate protein synthesis activity in this particular sample, which were quantified by ImageJ software and indicated at the bottom of each lane (details available in supplemental Methods). The protein synthesis in Wt–Fe BM samples is defined as 1 for samples from BM and spleens; for Wt–Fe blood samples, it is defined as 1 for comparison of protein synthesis in blood (right panel).
Inhibition of mTORC1 activity and protein synthesis in vivo by INK128. (A) mTORC1 activities measured by pS6 and p4EBP1 levels and (B) in vivo protein synthesis in the erythroid and non-erythroid cells in BM, spleen, and blood samples. Both Wt–Fe and Hri−/−–Fe mice were treated with vehicle or INK128 for 6 hours. Equal numbers of nucleated cells from BM and spleen were loaded, and the exposure time for developing the western blot was the same for BM and spleen. For blood samples, equal volumes of packed cells were loaded. For measurement of in vivo protein synthesis, the entire nitrocellulose membrane was incubated with anti-puromycin antibody. Puromycin signals from the entire lane of western blots demonstrate protein synthesis activity in this particular sample, which were quantified by ImageJ software and indicated at the bottom of each lane (details available in supplemental Methods). The protein synthesis in Wt–Fe BM samples is defined as 1 for samples from BM and spleens; for Wt–Fe blood samples, it is defined as 1 for comparison of protein synthesis in blood (right panel).
Protein synthesis in vivo was measured by incorporation of puromycin in nascent polypeptide chains of various molecular sizes (Figure 6B). Interestingly, INK128 did not inhibit protein synthesis in either Wt–Fe or Hri−/−–Fe blood cells. These results demonstrate that HRI-eIF2αP, and not mTORC1, controls protein synthesis of more mature reticulocytes in the blood in ID. However, INK128 strongly inhibited the incorporation of puromycin into nascent polypeptide chains in both erythroid and non-erythroid cells from BM and spleen of Wt–Fe and Hri−/−–Fe mice. Importantly, there were still higher rates of protein synthesis in erythroid cells, but not non-erythroid cells, from BM and spleen of Hri−/−–Fe mice compared with Wt–Fe after INK128 treatment. Thus, HRI-eIF2αP contributed to inhibition of protein synthesis in erythroid cells only during ID. Together, these results demonstrate that activation of mTORC1 signaling in ID occurs only in erythroid cells of Hri−/− mice, and this elevated mTORC1 signaling and protein synthesis are inhibited by INK128. Furthermore, mTORC1 signaling increased cell proliferation and cyclin D3 expression of late erythroblasts (supplemental Figure 6B-C).
Discussion
In this report, we provide novel molecular insights on coordinated translational regulation by HRI through eIF2αP and mTORC1 in iron-restricted erythropoiesis. HRI is necessary to balance heme and globin synthesis and to mitigate IE during ID in vivo.12 HRI also induces ISR in primary erythroblasts to protect against oxidative stress and to promote erythroid differentiation.14 Using novel eAA mice defective in eIF2αP signaling specifically in the erythroid lineage, we demonstrated that both eIF2αP and ATF4 of HRI-ISR are required in ID to repress mTORC1 signaling and mitigate IE. Although the role of ATF4 is limited to reducing oxidative stress and promoting erythroid differentiation, eIF2αP is additionally necessary for adaptation to microcytic hypochromic anemia in ID and for inhibition of globin translation so as to reduce globin inclusions. This role of HRI-eIF2αP in reducing unfolded cytoplasmic globins and promoting differentiation in erythroid cells during ID parallels the function of PERK-eIF2αP in reducing proinsulin translation and maintaining pancreatic β cells in the differentiated state,23 highlighting the tissue-specific mechanisms of activating eIF2α kinases in regulating highly and uniquely expressed proteins.
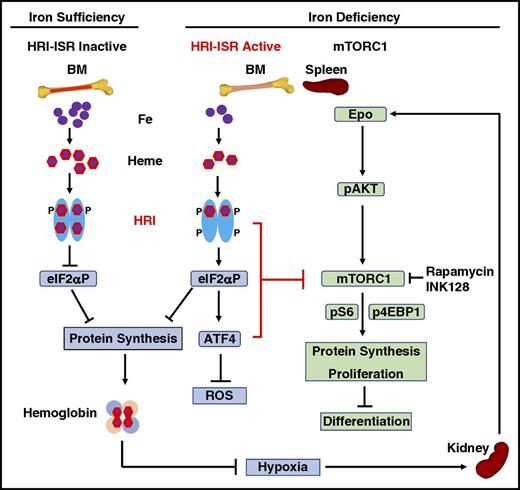
Our current model for HRI-ISR in the regulation of erythropoiesis systemically during ID in vivo is summarized in Figure 7. HRI senses intracellular heme concentrations through its heme-binding domains. In heme abundance, HRI is inactive; therefore, erythropoiesis of mutant mice defective in HRI-ISR is not significantly affected. In ID, heme concentration is decreased,12 leading to activation of HRI and eIF2αP to inhibit globin protein synthesis. Decreased Hb and hypoxia then induce Epo production by the kidney,18 inducing AKT/mTORC1 signaling to increase erythropoiesis.19 Hyporesponsiveness to Epo therapy is commonly encountered in ID,29 demonstrating some feedback mechanisms for homeostatic control of erythropoiesis by iron. This study provides evidence that HRI-ISR constitutes at least 1 mechanism of erythroid homeostasis in ID. In the absence of HRI-ISR and during ID, Hri−/−, eAA, and Atf4−/− mice developed IE with expansion of erythroblasts, defects in differentiation, and elevated mTORC1 signaling uniquely in erythroid precursors. Thus, HRI inhibits translation not only through eIF2αP but also via inhibition of mTORC1 signaling resulting from elevated Epo during ID. This increased protein synthesis in the absence of HRI signaling inhibits erythroid differentiation by increasing proliferation of erythroid precursors likely mediated through cyclin D3 expression. In addition, enhanced translation of ATF4 mRNA in ID by HRI-eIF2αP is necessary for reducing oxidative stress, which is not rescued by inhibitors of mTORC1.
Proposed model of heme regulation of erythropoiesis during ID in vivo by HRI through coordinated translational control at eIF2αP and mTORC1 signaling. Left: Steady-state erythropoiesis in the BM under iron sufficiency. In iron and thus heme abundance, HRI homodimer is inactive because of full occupancies of heme onto the 4 HRI heme binding domains unable to phosphorylate eIF2α, thus permitting global protein synthesis, mainly globin proteins in erythroid cells. Sufficient hemoglobin production maintains oxygen-delivering capacity in blood without hypoxia. Middle: Activation of HRI-ISR under ID mitigates IE. Under iron/heme deficiency, HRI in BM erythroid precursors is activated by the dissociation of heme. HRI then induces ISR, phosphorylating eIF2α, which inhibits globin protein synthesis and results in a decrease of hemoglobin content and consequently induction of tissue hypoxia stress. In addition, eIF2αP selectively enhances the translation of ATF4 mRNA to alleviate ROS levels. Most important and novel here is that HRI-ISR inhibits mTORC1 signaling to mitigate IE in the spleen. Right: Elevated mTORC1 signaling and development of IE in mutant mice defective in HRI-ISR signaling in ID. Hypoxia induced by ID stimulates Epo production in the kidney and increases Epo in blood circulation. In the spleen, binding of Epo to its receptors in erythroid precursors induces AKT/mTORC1 signaling, thus phosphorylating 4EBP1 and S6K/S6 to increase protein synthesis, promote proliferation, and inhibit erythroid differentiation, which are the characteristics of IE. HRI-ISR serves as feedback to inhibit mTORC1 signaling activity inhibiting the development of IE in ID.
Proposed model of heme regulation of erythropoiesis during ID in vivo by HRI through coordinated translational control at eIF2αP and mTORC1 signaling. Left: Steady-state erythropoiesis in the BM under iron sufficiency. In iron and thus heme abundance, HRI homodimer is inactive because of full occupancies of heme onto the 4 HRI heme binding domains unable to phosphorylate eIF2α, thus permitting global protein synthesis, mainly globin proteins in erythroid cells. Sufficient hemoglobin production maintains oxygen-delivering capacity in blood without hypoxia. Middle: Activation of HRI-ISR under ID mitigates IE. Under iron/heme deficiency, HRI in BM erythroid precursors is activated by the dissociation of heme. HRI then induces ISR, phosphorylating eIF2α, which inhibits globin protein synthesis and results in a decrease of hemoglobin content and consequently induction of tissue hypoxia stress. In addition, eIF2αP selectively enhances the translation of ATF4 mRNA to alleviate ROS levels. Most important and novel here is that HRI-ISR inhibits mTORC1 signaling to mitigate IE in the spleen. Right: Elevated mTORC1 signaling and development of IE in mutant mice defective in HRI-ISR signaling in ID. Hypoxia induced by ID stimulates Epo production in the kidney and increases Epo in blood circulation. In the spleen, binding of Epo to its receptors in erythroid precursors induces AKT/mTORC1 signaling, thus phosphorylating 4EBP1 and S6K/S6 to increase protein synthesis, promote proliferation, and inhibit erythroid differentiation, which are the characteristics of IE. HRI-ISR serves as feedback to inhibit mTORC1 signaling activity inhibiting the development of IE in ID.
Consistent with our results, mice with constitutively activated mTORC1 in the hematopoietic lineage exhibit macrocytic hyperchromic anemia with splenomegaly and IE,28 similar to the phenotypes of Hri−/− and eAA mice during ID. Although ATF4 is also necessary for inhibiting mTORC1 signaling during ID, Atf4−/− mice develop microcytic hypochromic anemia in contrast to Hri−/− and eAA mice. These results indicate that HRI-eIF2αP, which is hyperactivated in Atf4−/− mice, is more critical than mTORC1 in ID for developing microcytic hypochromic anemia.
Overexpression of eIF4E and sustained mTORC1 signaling in the erythroid progenitor cell line also impair differentiation.30,31 Recently, the mTORC1-4EBP pathway has been shown to coordinate globin translation with the availability of nonessential amino acids.32 However, the repression of mTORC1 signaling by HRI in splenic erythroblasts during ID reported here is mainly mediated through pS6. An additional role of mTORC1-mediated translation at earlier stages of erythropoiesis has recently been reported, demonstrating the regulation of mitochondrial biogenesis from hematopoietic stem/progenitor cells to proerythroblasts by mTORC1.33 Similar to our findings, that study also showed the unique requirement of mTORC1 signaling in erythropoiesis.
Importantly, we found that inhibition of mTORC1 signaling in iron-deficient Hri−/− and eAA mice by rapamycin and INK128 improves anemia, promotes erythroid differentiation, and attenuates IE. Rapamycin also improves anemia and promotes erythroid differentiation of Foxo3−/−, β-thalassemic, and sickle cell mice.34,35 Thus, elevated mTORC1 signaling may be a common phenomenon in IE. Our findings may provide a mechanism for improved pathology in thalassemic mice upon iron restriction36-38 via repression of both mTORC1 signaling and globin mRNA translation by HRI.
In summary, our study contributes molecular insights into the role of heme and translation in the regulation of erythropoiesis and provides the supporting evidence for the use of mTORC1 inhibitors in the treatment of hemoglobinopathy.
The online version of this article contains a data supplement.
The publication costs of this article were defrayed in part by page charge payment. Therefore, and solely to indicate this fact, this article is hereby marked “advertisement” in accordance with 18 USC section 1734.
Acknowledgments
This work was supported by National Institutes of Health, National Institute of Diabetes and Digestive and Kidney Diseases (NIDDK) grant RO1 DK087984 (J.-J.C.), NIDDK grants DK042394, DK103185, and DK110973 (R.J.K.), by National Institutes of Health, National Cancer Institute grant CA198103 (R.J.K.), and by a fellowship from Consejo Nacional de Ciencia y Tecnología in Mexico (A.M.-G).
Authorship
Contribution: S.Z. and A.M.-G. designed and conducted experiments and wrote the article; J.V. generated eAA mice; E.P. helped characterize the phenotypes of mice; R.J.K. provided the AATg mice and critiqued the article; and J.-J.C. designed experiments and wrote the article.
Conflict-of-interest disclosure: The authors declare no competing financial interests.
Correspondence: Jane-Jane Chen, Institute for Medical Engineering and Science, E25-421, Massachusetts Institute of Technology, Cambridge, MA 20139; e-mail: j-jchen@mit.edu.
References
Author notes
S.Z. and A.M.-G. contributed equally to this study.

This feature is available to Subscribers Only
Sign In or Create an Account Close Modal