Key Points
Pfn2 mRNA has a functional and conserved IRE in the 3′ untranslated region.
Pfn2 knockout mice display an iron phenotype with iron accumulation in specific areas of the brain and depletion of liver iron stores.
Abstract
Cellular iron homeostasis is controlled by the iron regulatory proteins (IRPs) 1 and 2 that bind cis-regulatory iron-responsive elements (IRE) on target messenger RNAs (mRNA). We identified profilin 2 (Pfn2) mRNA, which encodes an actin-binding protein involved in endocytosis and neurotransmitter release, as a novel IRP-interacting transcript, and studied its role in iron metabolism. A combination of electrophoretic mobility shift assay experiments and bioinformatic analyses led to the identification of an atypical and conserved IRE in the 3′ untranslated region of Pfn2 mRNA. Pfn2 mRNA levels were significantly reduced in duodenal samples from mice with intestinal IRP ablation, suggesting that IRPs exert a positive effect on Pfn2 mRNA expression in vivo. Overexpression of Pfn2 in HeLa and Hepa1-6 cells reduced their metabolically active iron pool. Importantly, Pfn2-deficient mice showed iron accumulation in discrete areas of the brain (olfactory bulb, hippocampus, and midbrain) and reduction of the hepatic iron store without anemia. Despite low liver iron levels, hepatic hepcidin expression remained high, likely because of compensatory activation of hepcidin by mild inflammation. Splenic ferroportin was increased probably to sustain hematopoiesis. Overall, our results indicate that Pfn2 expression is controlled by the IRPs in vivo and that Pfn2 contributes to maintaining iron homeostasis in cell lines and mice.
Introduction
Cellular iron metabolism is maintained posttranscriptionally by iron regulatory proteins (IRP) 1 and 2, which bind conserved RNA stem-loop structures named iron-responsive element (IRE).1 IRPs bind to IREs present in messenger RNAs (mRNAs) that encode proteins involved in iron acquisition (transferrin receptor 1, Tfr1, also known as Tfrc; divalent metal transporter 1, Dmt1, also known as Slc11a2), storage (ferritin H, Fth1; ferritin L, Ftl), utilization (erythroid 5-aminolevulinic acid synthase, Alas2; mitochondrial aconitase, Aco2), export (ferroportin, Fpn, also known as Slc40a1), and iron/oxygen sensing (hypoxia-inducible factor 2-α, Hif2a, also known as EPAS1).2-5
Functional IREs present a small asymmetrical cytosine bulge on the 5′ strand of the stem and a 6-nucleotide apical loop with the sequence 5′-CAGWGH-3′ (W = adenosine or uridine and H = adenosine, cytosine, or uridine). The first cytosine and the fifth guanosine are pairing, forming an AGW pseudotriloop. The IRP1-IRE crystal structure revealed that the C-bulge and the pseudotriloop residues are important protein contact points.6 The IRE upper stem consists of 5 paired nucleotides with or without the presence of an extra unpaired uridine residue downstream of the apical loop (Slc11a2 and Epas1 IREs), whereas the lower stem is of variable length.7,8
IRP binding to IREs is regulated by intracellular iron levels as well as by nitric oxide, oxidative stress, and hypoxia. IRP activity is high in iron-deficient cells and low in iron-replete conditions. Both IRPs inhibit translation when bound to an IRE located in the 5′ untranslated region (UTR), whereas their association with Tfrc 3′ UTR IREs prevents mRNA degradation.7-9
Combined, body-wide ablation of both IRP1 and 2 in mice is embryonically lethal, showing that the IRP/IRE system is essential.10,11 Tissue-specific coablation of both proteins also revealed important functions of the IRPs in the intestine,12,13 in the liver,14 as well as in macrophage-mediated immunity.15 On the other hand, excessive accumulation of IRP2 seemed lethal in mice,16 whereas a moderate gain of IRP1 function due to expression of a constitutively active Irp1 transgene resulted in macrocytic erythropenia associated with impaired erythroid differentiation.17 A key, yet unresolved question is whether all biological functions of IRP1 and/or IRP2 are achieved through regulation of the currently known IRE-containing genes, or whether there are other targets. We recently determined the IRP/IRE regulatory repertoire on a transcriptome-wide scale and identified novel mRNAs that bind to both IRPs,18 including profilin 2 (Pfn2).
Profilins constitute a family of small monomeric actin-binding proteins containing an actin-binding domain, a poly-l-proline–binding domain, and a phosphatidylinositol bisphosphate–binding domain.19 In mammals, 4 different profilin genes have been identified (Pfn1, Pfn2, Pfn3, and Pfn4) with Pfn2 being predominantly expressed in the central nervous system. In mouse brain, Pfn2 interacts with vesicle and membrane trafficking proteins such as dynamin 1 (Dnm1), a multimeric GTPase required for receptor-mediated endocytosis.20,21 Pfn2 binds with high affinity to Dnm1, resulting in its sequestration and thereby inhibiting endocytosis in neurons.22,23 Pfn2 ablation in mice results in viable rodents born with the expected Mendelian ratio, although ∼20% of the mutant pups do not reach weaning age, possibly because of behavioral deficits (P.P.B., unpublished observations). Compared with control, Pfn2-null animals are hyperreactive and show increased locomotion and exploratory behavior. This phenotype correlates with greater synaptic excitability and increased neurotransmitter release in glutamatergic neurons of the cortico-striatal pathway, because of higher probability of synaptic vesicle exocytosis24 ; therefore, Pfn2 appears to also negatively regulate vesicle exocytosis.24
In this work, we report the identification of a conserved IRE in the 3′ UTR of the Pfn2 mRNA and provide evidence that Pfn2 expression is modulated in vivo by the IRPs. We show that Pfn2 knockout (KO) mice have a hitherto unnoticed iron phenotype, with accumulation of the metal in specific areas of the brain and a concomitant depletion of liver iron stores. This study uncovers a novel player in the IRP/IRE regulatory system and unveils the previously unrecognized importance of Pfn2 for iron homeostasis.
Methods
Animals
Mice were kept on a constant 12-hour light/dark cycle, and food and water were supplied ad libitum. Male wild-type (WT) and Pfn2−/− littermates24 on a C57Bl6/N genetic background were euthanized at 7 to 9 months of age by cervical dislocation, and dissected tissues were flash-frozen in liquid nitrogen for RNA, protein, and iron quantification studies. For histological analysis, mice were anesthetized with ketamine and xylazine (1 and 0.1 mg per 10 g of body weight, intraperitoneally, respectively; Sigma-Aldrich) and subjected to transcardial perfusion. For hematological and biochemical studies, heparinized or EDTA blood was collected from tail vein or via cheek-bleeding. Bone marrow was flushed out from femur and tibia bones. All experiments were performed according to EU regulations (license nos. 19/2005-B and AZ 84-02.04.2013.A233).
Cell culture
HeLa and Hepa1-6 cells lines were obtained from ATCC (Wesel, Germany). Culture and transfection conditions for all cells used in the study are described in the supplemental Data, available on the Blood Web site.
Plasmid construction
Plasmids (I-12.CATwt and mut) for the synthesis of human FTH1-IRE probes for electrophoretic mobility shift assay (EMSA) were previously described.25 Mouse and human Pfn2 IRE sequences (WT or ΔA mutated) were subcloned into the I-12.CAT plasmid by replacement of the WT FTH1-IRE sequence using annealed synthetic oligonucleotides. A mouse Pfn2 full-length complementary DNA clone was purchased from OriGene Technologies. Fragments A-E in Pfn2 3′ UTR were amplified by polymerase chain reaction and cloned into pCMV-XL5 (OriGene Technologies) using EcoRI and HindIII restriction sites. The mutated fragment A was obtained by site-directed mutagenesis (Stratagene). Pfn2-Mut S138D plasmid was previously described.23 Primers used for cloning are listed in supplemental Table 1.
Nonradioactive competitive EMSA
RNA
Protocols for isolation of total RNA, reverse transcription, and quantitative polymerase chain reaction (qPCR) were described previously.18,26 Expression levels of housekeeping mRNAs (RPL19, Tbp, and β-actin) were used as calibration controls. Sequences for qPCR primers are listed in supplemental Table 1.
Labile iron pool assay and reactive oxygen species detection
Plasma IL-6 cytokine analysis
Whole blood was collected in EDTA tubes and centrifuged at 1500g for 15 minutes at 4°C. Plasma supernatants were aliquoted and frozen in liquid nitrogen. Plasma samples were diluted 1:2 in assay buffer and measured using the Mouse Angiogenesis/Growth Factor Magnetic Bead Kit for detection of interleukin-6 (IL-6; EMD Millipore; MAGPMAG-24K) together with xMAP platform (EMD Millipore) according to the manufacturer’s instructions. The data were analyzed with the MILLIPLEX Analyst Software.
Tissue iron content
Liver, duodenum, spleen, kidney, lung, heart, and skeletal muscle non–heme iron content was measured using the previously described bathophenanthroline colorimetric method.31,32 Total iron content of brain areas and bone marrow was determined by atomic absorption spectrometry as previously described.33 Further details are described in the supplemental Data.
Perls Prussian non–heme iron histochemistry
Total protein extraction and immunoblotting
Mouse tissues were lysed on ice in 44 mM Tris/HCl pH 6.8, 8% glycerol, 1.5% sodium dodecyl sulfate, 3.2% b-mercaptoethanol, 0.12% wt/vol bromophenol blue using a Potter-Elvehjem homogenizer with a polytetrafluoroethylene pestle at 600 rpm. Samples were then incubated for 10 minutes at 99°C (for ferroportin detection, the heat denaturation step was omitted). Total protein concentration was determined using the Pierce BCA Protein Assay kit (Themo Scientific) or the BioRad Bradford reagent following the manufacturer’s instructions. For details, see supplemental Data.
Statistics
Data are shown as mean values ± standard error of the mean unless otherwise indicated. Statistical analysis was performed using 2-tailed Student t test if 2 groups were compared, or 1-way analysis of variance test with Bonferroni multiple comparison post-hoc test if 3 or more groups were compared. P values are reported as follows: *.01 < P ≤ .05, **.001 < P ≤ .01, ***P ≤ .001. Statistical analysis of Affymetrix microarrays was performed using a moderated Student t test with Linear Models for Microarray Data,36 and P value was adjusted for multiple comparisons with FDR.37
Supplemental Data details the microarray analysis, transmission electron microscopy (TEM), and energy dispersive X-ray spectroscopy (EDS) measurements.
Results
Identification of Pfn2 as a novel IRP binding mRNA with a conserved 3′ UTR IRE
We have previously identified novel mRNAs that interact with IRP1 and/or IRP2 by combining immunoprecipitation and microarray analysis.18,38 Three independent Affymetrix probes identified Pfn2 as a mRNA associated with both IRPs in several mouse tissues.
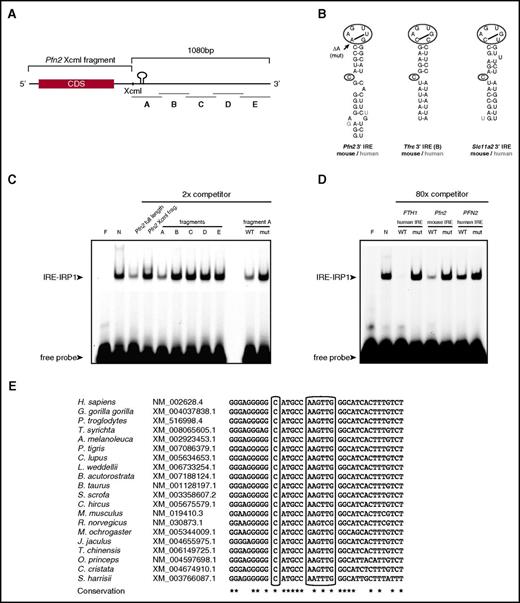
Although bioinformatics predictive tools such as the SIREs algorithm39 fail to recognize a canonical IRE motif in the Pfn2 transcript, the Pfn2 mRNA was enriched in a pull-down assay using recombinant IRP1 and RNA extracted from mouse spleen, brain, or liver (2.4- to 11.4-fold enrichment of Pfn2 mRNA, depending on tissue; supplemental Figure 1). Furthermore, a full-length Pfn2 transcript could displace the interaction between recombinant IRP1 and a ferritin H IRE probe in a competitive EMSA, whereas a Pfn2 transcript with most of its 3′ UTR deleted could not (Figure 1C). These results indicate that Pfn2 mRNA interacts with IRP1 through an element located within its 3′ UTR.18
Identification of the Pfn2 3′ UTR IRE and IRP binding studies. (A) Schematic representation of the Pfn2 mRNA. Coding region (black box), Pfn2 XcmI fragment, and fragments A to E and IRE are shown. (B). Human and mouse 3′ IRE motifs in Pfn2, Tfrc, and Slc11a2 mRNAs. Notice differences in sequence in the apical loop. The arrow indicates the deletion of the adenosine (ΔA, mut) used as mutant construct. (C) Nonradioactive competitive EMSA using fluorescent ferritin H IRE-labeled probe and twofold molar excess of unlabeled competitors (full-length Pfn2 mRNA or Pfn2 mRNA fragments). Constructs or fragments (XcmI fragment, A to E fragment) used as competitors are indicated. Mut, fragment A containing a single deletion in the first A of the 6-nucleotides apical loop; WT, wild-type fragment A. One representative experiment out of 4 is shown. (D) Nonradioactive competitive EMSA using fluorescent ferritin H IRE-labeled probe and 80-fold molar excess of unlabeled competitors (ferritin H or mouse and human Pfn2 IRE sequences). (E) Representative phylogenic conservation of the Pfn2 IRE among mammals; an extended alignment is shown in supplemental Figure 2. Asterisks (*) indicate residues conserved in all aligned species. CDS, coding sequence.
Identification of the Pfn2 3′ UTR IRE and IRP binding studies. (A) Schematic representation of the Pfn2 mRNA. Coding region (black box), Pfn2 XcmI fragment, and fragments A to E and IRE are shown. (B). Human and mouse 3′ IRE motifs in Pfn2, Tfrc, and Slc11a2 mRNAs. Notice differences in sequence in the apical loop. The arrow indicates the deletion of the adenosine (ΔA, mut) used as mutant construct. (C) Nonradioactive competitive EMSA using fluorescent ferritin H IRE-labeled probe and twofold molar excess of unlabeled competitors (full-length Pfn2 mRNA or Pfn2 mRNA fragments). Constructs or fragments (XcmI fragment, A to E fragment) used as competitors are indicated. Mut, fragment A containing a single deletion in the first A of the 6-nucleotides apical loop; WT, wild-type fragment A. One representative experiment out of 4 is shown. (D) Nonradioactive competitive EMSA using fluorescent ferritin H IRE-labeled probe and 80-fold molar excess of unlabeled competitors (ferritin H or mouse and human Pfn2 IRE sequences). (E) Representative phylogenic conservation of the Pfn2 IRE among mammals; an extended alignment is shown in supplemental Figure 2. Asterisks (*) indicate residues conserved in all aligned species. CDS, coding sequence.
To delineate the exact position of this element, we subcloned and tested 5 overlapping 250-bp fragments of the Pfn2 mRNA 3′ UTR (Figure 1A) in competitive EMSAs using recombinant IRP1 (Figure 1C) or IRP2 (supplemental Figure 3A). We found that the interaction between Pfn2 mRNA and the IRPs was mediated by the most upstream region (fragment A) of the Pfn2 mRNA 3′ UTR (Figure 1C; supplemental Figure 3). A detailed mRNA folding analysis identified a noncanonical IRE motif 326 bp downstream of the stop codon (Figure 1B). The Pfn2 IRE motif is conserved across several mammalian species (Figure 1E; supplemental Figure 2), and similarly to other IREs, consists of a 5-paired upper stem and a midstem C bulge (C8; Figure 1B), but differs from a canonical motif by the sequence of the hexanucleotide apical loop (AAGUUG instead of CAGUGH). Nonetheless, the first and the fifth ribonucleotide (adenosine and uridine) can pair, allowing the formation of an AGU pseudotriloop (Figure 1B), and deletion of the first adenosine in the apical loop (AAGUUG; Figure 1B) of the mouse and human PFN2 IREs abrogates binding to IRP1 and IRP2, as assessed by competitive EMSA (Figure 1D; supplemental Figure 3). We also demonstrated that the IRP-IRE competitive binding is dose dependent for Pfn2 mRNA (supplemental Figure 3B). Of note, 2 isoforms of the mouse Pfn2 mRNA have been described.40 These splice variants differ in the first 267 bp of the last exon and yield 2 proteins with different C-terminal amino-acid composition,40,41 but both retain the 3′-IRE motif.
Altogether, these results reveal the presence of a conserved IRE in the 3′ UTR of Pfn2 mRNA bound by both IRP1 and IRP2.
Modulation of Pfn2 expression by IRPs
The Tfrc mRNA, which contains 5 IREs in its 3′ UTR, is stabilized upon IRP binding in iron-deficient cells and is conversely degraded in iron-replete conditions when IRP activity is low. We therefore tested whether Pfn2 mRNA expression is regulated by iron in 4 different cell lines (NIH3T3, RAW264, Hepa1-6, and AML12). Contrasting with Tfrc, Pfn2 transcript levels did not increase upon iron chelation with deferoxamine (DFO), as assessed by qPCR; we even observed a significant reduction of Pfn2 mRNA levels in Hepa1-6 cells (supplemental Figure 4A, Pfn2). Pfn2 mRNA expression was nonetheless reduced in Hepa1-6 cells upon iron loading with hemin (supplemental Figure 4A, Pfn2). A time course experiment in Hepa1-6 cell lines showed that Pfn2 mRNA levels were significantly and constantly decreased after 5, 10, 15, and 20 hours of hemin treatment, similarly to the Tfrc mRNA, whereas Pfn2 mRNA reduction after DFO treatment was only transient (supplemental Figure 4B). Because IRE activity can be context dependent12 and the regulation of Pfn2 via its 3′ UTR IRE may not be recapitulated in cultured cell lines, we also tested if Pfn2 mRNA expression was modulated in C57BL/6 mice fed with a low-iron diet. Tfrc mRNA expression was expectedly increased in the liver, duodenum, and spleen of iron-deficient mice, but Pfn2 mRNA remained unchanged (supplemental Figure 5). Hence, iron depletion alone seems not to suffice to stimulate Pfn2 mRNA expression neither in cultured cells nor in mice, at least under the experimental conditions tested.
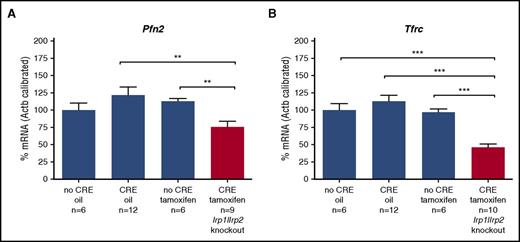
We therefore took advantage of a mouse model with acute loss of IRP1 and IRP2 function in the intestinal mucosa to study the impact of the IRPs on Pfn2 expression in vivo.12 As expected, Tfrc mRNA levels were reduced by ∼50% (Figure 2). Importantly, Pfn2 mRNA levels were also significantly decreased (25%). These results thus indicate that IRPs exert a positive effect on Pfn2 mRNA expression, as expected for a 3′ UTR IRE-containing transcript.
Duodenal expression levels of Pfn2 mRNA in mice with intestinal IRP1 and IRP2 depletion in adult stage. IRP1 and IRP2 deficiency was obtained using the Cre/LoxP technology in a tamoxifen-inducible system in the intestinal mucosa. Adult animals carrying floxed IRP alleles plus the Cre-ERT (XerC recombinase fused to an estrogen receptor tamoxifen-activated) transgene were given tamoxifen (1 mg intraperitoneally per animal per day on 5 consecutive days) to trigger IRP ablation in the intestine. Mice were euthanized 5 weeks after the last tamoxifen injection and Pfn2 mRNA levels (A) as well as Tfrc mRNA levels (B) were assesed by qPCR. Control mice (blue bars) were WT mice treated with oil (no CRE oil) or tamoxifen (no CRE tamoxifen), or CRE-expressing mice receiving the vehicle only (CRE oil). Tfrc mRNA expression was assessed as a molecular signature of IRP deficiency. The histograms represent mRNA levels after calibration to β-actin and normalization to the “no Cre oil” control. P values were determined by unpaired 2-tailed Student t test, **P ≤ .01, ***P ≤ .001.
Duodenal expression levels of Pfn2 mRNA in mice with intestinal IRP1 and IRP2 depletion in adult stage. IRP1 and IRP2 deficiency was obtained using the Cre/LoxP technology in a tamoxifen-inducible system in the intestinal mucosa. Adult animals carrying floxed IRP alleles plus the Cre-ERT (XerC recombinase fused to an estrogen receptor tamoxifen-activated) transgene were given tamoxifen (1 mg intraperitoneally per animal per day on 5 consecutive days) to trigger IRP ablation in the intestine. Mice were euthanized 5 weeks after the last tamoxifen injection and Pfn2 mRNA levels (A) as well as Tfrc mRNA levels (B) were assesed by qPCR. Control mice (blue bars) were WT mice treated with oil (no CRE oil) or tamoxifen (no CRE tamoxifen), or CRE-expressing mice receiving the vehicle only (CRE oil). Tfrc mRNA expression was assessed as a molecular signature of IRP deficiency. The histograms represent mRNA levels after calibration to β-actin and normalization to the “no Cre oil” control. P values were determined by unpaired 2-tailed Student t test, **P ≤ .01, ***P ≤ .001.
Pfn2 regulates the cLIP of the cell
Because Pfn2 is regulated by the IRPs, the key regulators of iron metabolism in the cell, we next studied the influence of Pfn2 on cellular iron metabolism. Ectopic overexpression of WT Pfn2 in HeLa cells was previously reported to inhibit endocytosis, thereby blocking transferrin uptake. This effect was not observed with a mutant Pfn2 form (Pfn2-Mut S138D) that binds actin but not dynamin 1.23
To further study the effect of Pfn2 on cellular iron levels, we transiently overexpressed either the WT or the mutated (mut S138D) form of Pfn2 in HeLa cells and measured the cytoplasmic labile iron pool (cLIP). Overexpression of both clones was at similar levels (data not shown). As control, cells were either transfected with mouse ferritin H (Fth1) or treated with DFO to chelate iron and thus reduce the cLIP; conversely, they were treated with ferric ammonium citrate to increase the cLIP.
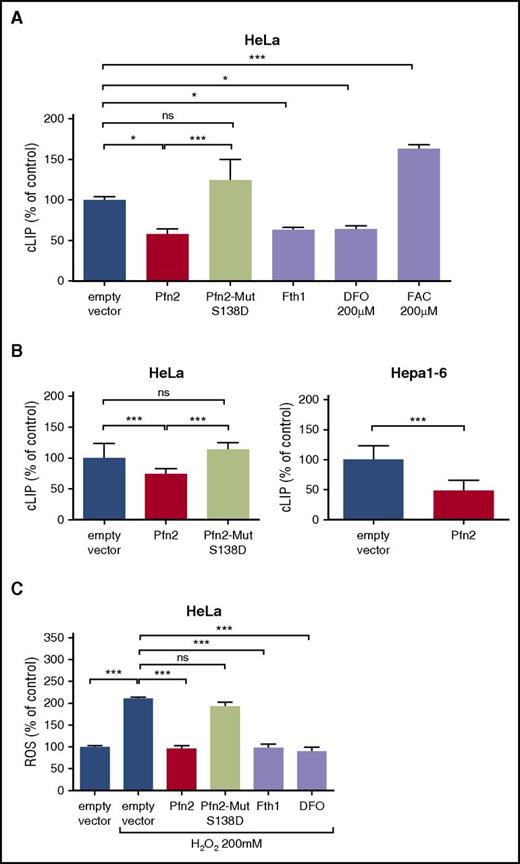
We found that overexpression of WT Pfn2 reduced the LIP as efficiently as Fth1 or DFO treatment, whereas overexpression of the S138D Pfn2 mutant had no effect (Figure 3A). Similar results were obtained in HeLa and Hepa1-6 cells stably overexpressing Pfn2 vs Pfn2-Mut S138D (Figure 3B). To further demonstrate that Pfn2 reduces cellular iron availability, we measured ROS levels in H2O2-treated cells. We found that transient WT Pfn2 expression reduced ROS levels in H2O2-treated HeLa cells, and that overexpression of Pfn2-Mut S138D has no effect on ROS (Figure 3C). These data demonstrate that Pfn2 decreases the metabolically active iron pool in the cell.
LIP and ROS levels in cell lines overexpressing Pfn2. (A) HeLa cells were transiently transfected with pCMV6-Kan/Neo empty vector, pCMV6-Pfn2, or Pfn2-Mut S138D vector. As control, cells were transfected with pCMV6-Fth1 vector or with the empty vector and treated with 200 µM DFO or 200 µM ferric ammonium citrate (FAC) for 16 hours. cLIP was measured by the calcein-AM method 48 hours after transfection. Data were normalized to cells transfected with the empty vector, set as 100%. Means ± standard deviation (SD) are shown. (B) Stable Hepa1-6 and HeLa clones overexpressing the WT mouse Pfn2 or Pfn2-Mut S138D were isolated, and LIP was measured and normalized to cells stably transfected with the pCMV6 empty vector, set as 100%. Means ± SD are shown. (C) ROS levels were measured using the 2′,7′-dichlorofluorescin diacetate method in HeLa cells transiently transfected with pCMV6-Kan/Neo empty vector, pCMV6-Pfn2, Pfn2-Mut S138D, or pCMV6-Fth1 vectors or in cells transfected with the empty vectors and treated with 200 µM DFO for 16 hours. ROS levels were assayed 48 hours after transfection following a pretreatment with 200 µM H2O2 to induce ROS generation. ROS quantifications were normalized to cells transfected with the empty vector and not treated with H2O2, set as 100%. Means ± SD are shown. *P ≤ .05, ***P ≤ .001. ns, not significant.
LIP and ROS levels in cell lines overexpressing Pfn2. (A) HeLa cells were transiently transfected with pCMV6-Kan/Neo empty vector, pCMV6-Pfn2, or Pfn2-Mut S138D vector. As control, cells were transfected with pCMV6-Fth1 vector or with the empty vector and treated with 200 µM DFO or 200 µM ferric ammonium citrate (FAC) for 16 hours. cLIP was measured by the calcein-AM method 48 hours after transfection. Data were normalized to cells transfected with the empty vector, set as 100%. Means ± standard deviation (SD) are shown. (B) Stable Hepa1-6 and HeLa clones overexpressing the WT mouse Pfn2 or Pfn2-Mut S138D were isolated, and LIP was measured and normalized to cells stably transfected with the pCMV6 empty vector, set as 100%. Means ± SD are shown. (C) ROS levels were measured using the 2′,7′-dichlorofluorescin diacetate method in HeLa cells transiently transfected with pCMV6-Kan/Neo empty vector, pCMV6-Pfn2, Pfn2-Mut S138D, or pCMV6-Fth1 vectors or in cells transfected with the empty vectors and treated with 200 µM DFO for 16 hours. ROS levels were assayed 48 hours after transfection following a pretreatment with 200 µM H2O2 to induce ROS generation. ROS quantifications were normalized to cells transfected with the empty vector and not treated with H2O2, set as 100%. Means ± SD are shown. *P ≤ .05, ***P ≤ .001. ns, not significant.
Abnormal iron distribution in Pfn2-deficient mice
Pfn2−/− mice have been reported to have neuronal hyperexcitability because of increased synaptic vesicle exocytosis.24 However, the role of Pfn2 in iron metabolism has not been addressed. In light of our finding that Pfn2 influences iron metabolism in cultured cells, we next studied the role of Pfn2 in iron metabolism in vivo in Pfn2-null mice.
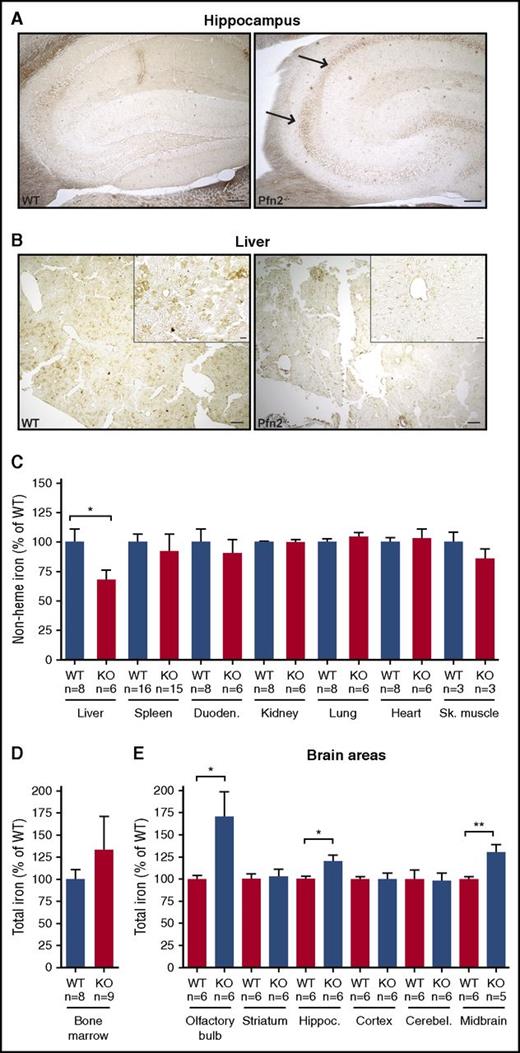
Enhanced Prussian blue staining of iron with the Perls perfusion method was performed in key organs of iron homeostasis, including the duodenum (site of iron absorption), the liver (site of iron storage), the spleen (site of iron recycling), and the bone marrow (site of iron utilization). We also analyzed the brain and kidney because of high Pfn2 expression in those tissues. We did not observe any change in the amount and distribution of iron in the duodenum, spleen, bone marrow, and kidney of Pfn2-deficient mice (data not shown). This observation was confirmed by quantification of total non–heme iron levels in duodenum, spleen, and kidney with the bathophenanthroline chromogen method (Figure 4C), and in the bone marrow by atomic absorption spectrometry measurement of total iron (Figure 4D). Hence, Pfn2 seems dispensable for maintaining iron homeostasis in the intestine, spleen, kidney, and bone marrow of mice kept under standard laboratory conditions. Interestingly, iron deposits were observed in particular brain areas such as the Ammon horn of the hippocampus (Figure 4A). The analysis of dissected brain tissue by atomic absorption spectrometry confirmed the accumulation of iron in the hippocampus but also in the olfactory bulb and the midbrain of Pfn2−/− mice (Figure 4E). Contrasting with iron loading of neurons, liver parenchymal cells show a loss of iron stores (Figure 4B), and iron levels in the liver of Pfn2-null animals were reduced by 40% (Figure 4C). Similar results were obtained in 2- to 3-week-old mice (data not shown), indicating that liver iron depletion occurs early in life. Depletion of the liver iron store was not due to increased urinary iron excretion (supplemental Figure 6) and was not associated with any hematological abnormality nor with any alteration of serum iron parameters (supplemental Table 2).
Abnormal iron distribution in Pfn2−/−vs WT mice. Enhanced Prussian blue staining in brain (A) and liver (B) of Perls-perfused Pfn2−/− and WT mice. In the Pfn2−/− brain section, the arrows point to CA1-CA2 hippocampal regions, enriched in iron. In contrast, iron is lost in liver parenchymal cells. Scale is 100 µm in panel A, and 200 µm in low-magnification panels and 20 µm in the high-magnification insets in panel B. (C) Tissue non–heme iron content measured using the bathophenanthroline chromogen method in the indicated tissues shows a loss of 40% of iron in the liver of Pfn2−/− mice. Total iron content measured by atomic absorption method in bone marrow (D) and brain areas (E) shows iron overload in olfactory bulbs, hippocampus, and midbrain of Pfn2−/− mice. Measures are given as percentage of control WT littermates. The sample size (n) is indicated. P values were determined by unpaired 2-tailed Student t test, *P ≤ .05, **P ≤ .01.
Abnormal iron distribution in Pfn2−/−vs WT mice. Enhanced Prussian blue staining in brain (A) and liver (B) of Perls-perfused Pfn2−/− and WT mice. In the Pfn2−/− brain section, the arrows point to CA1-CA2 hippocampal regions, enriched in iron. In contrast, iron is lost in liver parenchymal cells. Scale is 100 µm in panel A, and 200 µm in low-magnification panels and 20 µm in the high-magnification insets in panel B. (C) Tissue non–heme iron content measured using the bathophenanthroline chromogen method in the indicated tissues shows a loss of 40% of iron in the liver of Pfn2−/− mice. Total iron content measured by atomic absorption method in bone marrow (D) and brain areas (E) shows iron overload in olfactory bulbs, hippocampus, and midbrain of Pfn2−/− mice. Measures are given as percentage of control WT littermates. The sample size (n) is indicated. P values were determined by unpaired 2-tailed Student t test, *P ≤ .05, **P ≤ .01.
Together, these results show that Pfn2 plays an important role in brain and liver iron metabolism.
Brain iron accumulation in Pfn2−/− mice
Total iron was selectively increased in the olfactory bulb, hippocampus, and midbrain of 7- to 9-month-old Pfn2−/− mice, the 3 areas where Pfn2 expression levels are highest (C. Liemersdorf, I. D. Ozer, A. Husch, W.W., and P.P.B., manuscript in preparation), but was unchanged in other brain regions, such as striatum, cortex, and cerebellum (Figure 4E).
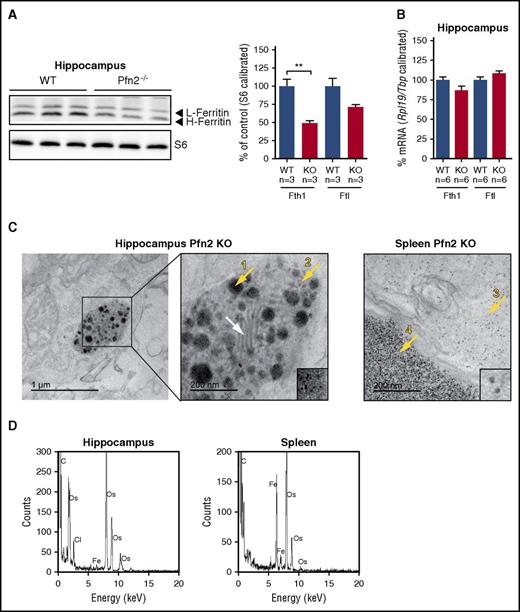
Despite iron loading, ferritin protein levels in hippocampus were reduced (Figure 5A), with no concomitant change in Fth1 and Ftl mRNA levels (Figure 5B). TEM in the hippocampus of Pfn2-deficient mice revealed abnormal electron-dense aggregates inside a subset of membrane organelles that resemble mitochondria, as indicated by the presence of lamellae (Figure 5C white arrow). The presence of iron aggregates in hippocampus was confirmed by EDS (Figure 5D). A closer look at these organelles revealed 2 electron-dense structures possibly corresponding to iron deposits: large amorphous biomineral aggregates (Figure 5C arrow 1) and more defined nanoparticles (Figure 5C arrow 2). Both entities are different from the typical iron aggregate present in spleen as ferritin shells (Figure 5C arrow 3) or as hemosiderin (Figure 5C arrow 4). Structurally, both hippocampal iron-containing species (arrow 1 and 2) differ from normal and pathological (observed in neurodegenerative diseases) cytoplasmic ferritins deposits40,42 and from the mitochondrial biomineral iron aggregates found in the heart of Friedreich ataxia mice.43
Ferritin L and H protein and mRNA levels and iron deposits in the hippocampus of Pfn2−/−mice. (A) Hippocampal ferritin L (Ftl) and ferritin H (Fth1) protein measured by western blotting are reduced in Pfn2 KO mice compared with WT controls. Ribosomal protein S6 levels were used for calibration. Graphs represent quantified data normalized to the WT control (set as 100%). Sample size (n) is indicated. (B) Hippocampal ferritin L (Ftl) and ferritin H (Fth1) mRNA levels measured by qPCR show no difference between Pfn2−/− and WT control mice. mRNA expression was calibrated with ribosomal protein L19 (Rpl19) and TATA box binding protein (Tbp) mRNA expression and normalized to WT mice (set as 100%). Sample size (n) is indicated. (C) On the left side, TEM sample image from the hippocampus of a Pfn2−/−mouse. The boxed area is magnified on its right. On the right side, sample image from the spleen of a Pfn2−/− mouse. TEM images of hippocampus (second image) and spleen (third image from left) are at the same magnification for comparison of the aggregates size and morphology. Lamellae structures characterizing a mitochondrion are highlighted by a white arrow. Iron aggregates of different morphologies are indicated by yellow arrows: mitochondrial amorphous and big clustered aggregates (1), isolated biomineral nanoparticles (2), cytoplasm dispersed ferritin cores (3), and spleen hemosiderin aggregates (4). Small insets from center and right TEM images are at the same magnification, showing the smaller particle size observed in hippocampus (2) in comparison with the spleen ferritin cores (3). (D) In the hippocampus and spleen of Pfn2−/−mice, electron-dense areas have been tested by EDS to confirm the presence of iron. **P ≤ .01.
Ferritin L and H protein and mRNA levels and iron deposits in the hippocampus of Pfn2−/−mice. (A) Hippocampal ferritin L (Ftl) and ferritin H (Fth1) protein measured by western blotting are reduced in Pfn2 KO mice compared with WT controls. Ribosomal protein S6 levels were used for calibration. Graphs represent quantified data normalized to the WT control (set as 100%). Sample size (n) is indicated. (B) Hippocampal ferritin L (Ftl) and ferritin H (Fth1) mRNA levels measured by qPCR show no difference between Pfn2−/− and WT control mice. mRNA expression was calibrated with ribosomal protein L19 (Rpl19) and TATA box binding protein (Tbp) mRNA expression and normalized to WT mice (set as 100%). Sample size (n) is indicated. (C) On the left side, TEM sample image from the hippocampus of a Pfn2−/−mouse. The boxed area is magnified on its right. On the right side, sample image from the spleen of a Pfn2−/− mouse. TEM images of hippocampus (second image) and spleen (third image from left) are at the same magnification for comparison of the aggregates size and morphology. Lamellae structures characterizing a mitochondrion are highlighted by a white arrow. Iron aggregates of different morphologies are indicated by yellow arrows: mitochondrial amorphous and big clustered aggregates (1), isolated biomineral nanoparticles (2), cytoplasm dispersed ferritin cores (3), and spleen hemosiderin aggregates (4). Small insets from center and right TEM images are at the same magnification, showing the smaller particle size observed in hippocampus (2) in comparison with the spleen ferritin cores (3). (D) In the hippocampus and spleen of Pfn2−/−mice, electron-dense areas have been tested by EDS to confirm the presence of iron. **P ≤ .01.
Hepatic iron metabolism in Pfn2−/− mice
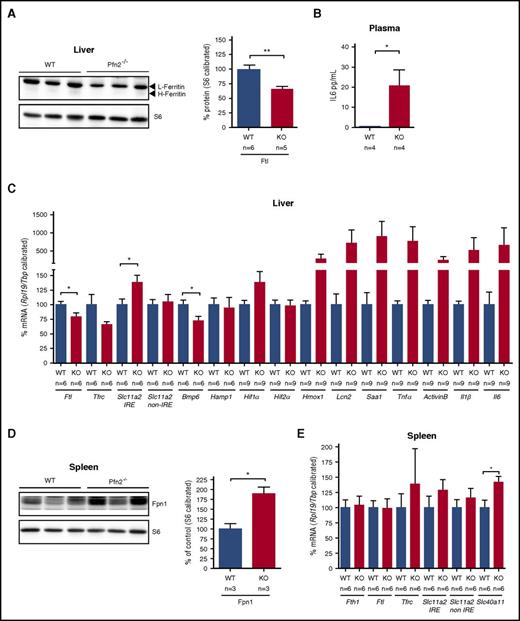
The decrease of liver iron content in Pfn2−/− mice was accompanied by a significant reduction of ferritin L expression at both the protein (Figure 6A) and the mRNA level (Figure 6C). In line with the decreased hepatic iron content, Bmp6 mRNA expression in Pfn2−/− livers was reduced by 30% (Figure 6C). Although the reduction of the liver iron content and the concomitant suppression of Bmp6 would predict a decrease in hepcidin expression, hepatic Hamp1 mRNA levels remain unchanged in Pfn2−/− mice (Figure 6C). We hypothesized that antagonistic cues such as inflammation44 could counteract the regulation of Hamp1 by low iron in Pfn2−/− animals. Indeed, expression array analysis of Pfn2−/− livers (supplemental Table 3) revealed a mild activation of the Il6 pathway (activation z score: 0.247) associated with the upregulation of several Il6-target genes (supplemental Table 4). In line with this observation, plasma Il6 concentration was found to be elevated in Pfn2−/− animals (Figure 6B). Furthermore, Pfn2-deficient mice displayed a tendency for increased expression of several proinflammatory cytokine mRNAs in the liver, including Saa1, Tnfα, ActivinB, Il1β, and Il6 (Figure 6C). Thus, the failure to downregulate Hamp1 in Pfn2−/− animals with low hepatic iron stores could be explained by concomitant stimulation of the gene's transcription under mild proinflammatory conditions.
Protein and RNA levels of iron-related genes in liver and spleen of Pfn2−/−and WT mice. Liver (A) ferritin L and ferritin H protein levels measured by western blotting are reduced in Pfn2−/− mice compared with WT controls, whereas splenic (D) ferroportin protein levels are increased in Pfn2−/− mice compared with WT controls. Ribosomal protein S6 levels were used for calibration. Graphs represent quantified data normalized to the WT sample (set as 100%). Samples size (n) is indicated. RNA expression of iron-related genes was analyzed by qPCR in liver (C) and spleen (E). mRNA expression was calibrated with Rpl19 and Tbp mRNA expression and normalized to WT mice (set as 100%). Sample size (n) is indicated. (B) Plasma levels of Il6 were measured by Luminex immunoassay. Bmp6, bone morphogenetic protein 6;Hamp1, hepcidin; Hif1α/2α, hypoxia inducible factor 1α/2α; Hmox1, heme oxygenase 1; Il1β/6, interleukin1β/6; Lcn2, lipocalin 2; Saa1, serum amyloid A1; Slc40a11, ferroportin (protein: Fpn1); Tnfα, tumor necrosis factorα. *P ≤ .05, **P ≤ .01.
Protein and RNA levels of iron-related genes in liver and spleen of Pfn2−/−and WT mice. Liver (A) ferritin L and ferritin H protein levels measured by western blotting are reduced in Pfn2−/− mice compared with WT controls, whereas splenic (D) ferroportin protein levels are increased in Pfn2−/− mice compared with WT controls. Ribosomal protein S6 levels were used for calibration. Graphs represent quantified data normalized to the WT sample (set as 100%). Samples size (n) is indicated. RNA expression of iron-related genes was analyzed by qPCR in liver (C) and spleen (E). mRNA expression was calibrated with Rpl19 and Tbp mRNA expression and normalized to WT mice (set as 100%). Sample size (n) is indicated. (B) Plasma levels of Il6 were measured by Luminex immunoassay. Bmp6, bone morphogenetic protein 6;Hamp1, hepcidin; Hif1α/2α, hypoxia inducible factor 1α/2α; Hmox1, heme oxygenase 1; Il1β/6, interleukin1β/6; Lcn2, lipocalin 2; Saa1, serum amyloid A1; Slc40a11, ferroportin (protein: Fpn1); Tnfα, tumor necrosis factorα. *P ≤ .05, **P ≤ .01.
Our expression array analysis overall showed 20 upregulated and 29 downregulated genes in the liver of Pfn2−/− mice compared with control littermates (representing 0.06% and 0.08%, respectively, of the tested transcriptome) (supplemental Table 4). Lipocalin 2, an iron-trafficking protein that mediates the uptake of siderophores and catechol-Fe(III) complexes,45,46 was among the upregulated genes and its increase was confirmed by qPCR (Figure 6C).
Iron uptake in liver is also dependent on Dmt1, which is encoded by the Slc11a2 gene.1 We analyzed the expression of the Slc11a2-IRE and non-IRE mRNA isoforms47 by qPCR. We observed a statistically significant and specific upregulation of the Slc11a2-IRE mRNA isoform in Pfn2−/− liver samples (Figure 6C), which could possibly be due to increased IRP binding to the Slc11a2-IRE mRNA under iron-deficient conditions.
Spleen iron metabolism in Pfn2−/− mice
Spleen non–heme size and iron content were comparable between Pfn2−/− mice and control mice (Figure 4C; supplemental Figure 7A). No evidence of extramedullary hematopoiesis was detected in Pfn2−/− mice (supplemental Figure 7B-C). Splenic structural iron deposits studied by TEM were expectedly present in lysosome-like structures arranged in ≈5-nm large electron-dense nanoparticles (corresponding to the ferritin iron cores) that are usually described as hemosiderin (Figure 5C arrow 4). Accordingly, ferritin L and H mRNA and protein levels were not changed (Figure 6E and data not shown). However, we detected a statistically significant increase in ferroportin protein and RNA level in the spleen of Pfn2−/− mice (Figure 6D-E), which could serve as a means to counterbalance the effect of inappropriately normal hepcidin levels on ferroportin membrane expression.
Discussion
IRP-mutant mouse models revealed that the IRP/IRE regulatory system is critical for securing physiological iron distribution between major sites of systemic iron homeostasis. Here, we describe a new IRP mRNA target, Pfn2, and unveil a novel function for this actin-binding protein in iron metabolism.
We show that Pfn2 mRNA harbors a conserved and functional IRE in its 3′ UTR. Similar to the well-characterized 3′ IRE-containing Tfrc mRNA, Pfn2 transcript levels are reduced upon IRP ablation in vivo in mice. Nevertheless, steady-state Pfn2 mRNA levels are largely unchanged under iron-deficient conditions, both in cultured cells and in mice. The lack of iron regulation of Pfn2 is not totally surprising, because it is already known that, for example, the modulation of the Slc11a2 mRNA by iron is cell-line specific and is influenced by the differentiation state of the cell.4 In addition, multiple integrative and opposing signals contribute to the regulation of several single IRE-containing mRNAs, such as Epas1 (protein HIF2alpha), Slc40a1 (protein ferroportin), and Slc11a2 (protein Dmt1). Overall, it seems that a straightforward regulation of 3′ IRE–containing mRNAs by iron levels and IRPs is only consistently observed in the case of Tfrc, although even for this transcript the fold regulation is very variable and depends on the cell line or tissue analyzed.
On the other hand, mice with constitutive deficiency of Pfn2 exhibit a striking iron phenotype, with iron accumulation in specific areas of the brain and a reduction of the liver iron stores, although displaying normal red blood cell counts and plasma iron parameters.
Iron accumulation in the brain of Pfn2−/− mice correlates with the expression pattern of Pfn2, being the highest in hippocampus, olfactory bulb, and midbrain (C. Liemersdorf, I. D. Ozer, A. Husch, W.W., and P.P.B., manuscript in preparation). It is well established that iron bound to transferrin is internalized through receptor-mediated endocytosis of Tfr1, involving clathrin-coated pits and Dnm1.48 Pfn2 interacts with and sequesters Dnm1 in neurons, thereby preventing its binding to endocytic effectors.23 Thus, Pfn2 acts as a negative regulator of endocytosis. Indeed, neurons from Pfn2-KO mice show increased endocytic rate, and ectopic overexpression of Pfn2 in HeLa cells slows down transferrin uptake.23 In this work, we observed that Pfn2 overexpression in several cell lines decreased the cLIP. Hence, it is conceivable that the iron overload in the brain of Pfn2−/− mice is due to an increased rate of transferrin-Tfr1 endocytosis in the absence of Pfn2 (Figure 7). Interestingly, we show that iron accumulation in the hippocampus of Pfn2−/− mice occurs in previously undescribed biomineral iron forms inside organelles, whose membrane structure resembles mitochondria. As Pfn2−/− mice do not manifest overt neurodegeneration or ataxia, we hypothesize that the iron aggregates could be a harmless way to confine the otherwise highly toxic iron excess inside the neurons.
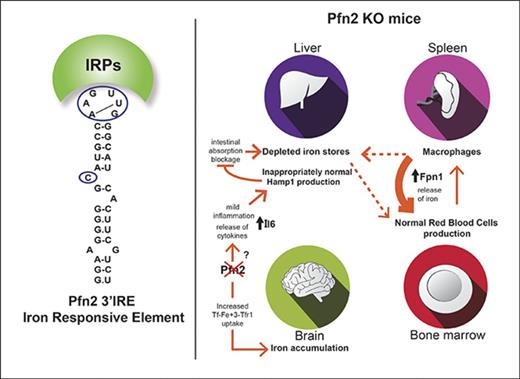
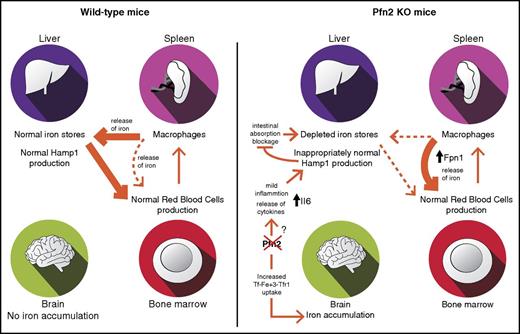
Model for systemic iron distribution and homeostasis in WT vs Pfn2−/−mice. Pfn2 KO mice exhibit brain iron accumulation and depletion of liver iron stores with normal hematological parameters. Brain iron overload can be attributed to an increase in transferrin-transferrin receptor endocytosis (Tf-Fe3+-TfR1) because of the lack of Pfn2 that negatively regulates this process. Although in WT mice erythropoiesis is supported mainly by liver but also splenic iron, in Pfn2−/− mice erythropoiesis is supported exclusively by the spleen, where we have detected a substantial increase in ferroportin (Fpn1) production. In Pfn2−/− mice hepcidin (Hamp1), production in liver is inappropriately normal despite low-iron levels, which should downregulate hepcidin production in order to increase dietary iron absorption and restore liver iron content. Hepcidin inappropriately normal levels in liver of Pfn2−/−mice are caused by a mild increase in the release of Il6 proinflammatory cytokine that can overrule opposite inhibitory signals.
Model for systemic iron distribution and homeostasis in WT vs Pfn2−/−mice. Pfn2 KO mice exhibit brain iron accumulation and depletion of liver iron stores with normal hematological parameters. Brain iron overload can be attributed to an increase in transferrin-transferrin receptor endocytosis (Tf-Fe3+-TfR1) because of the lack of Pfn2 that negatively regulates this process. Although in WT mice erythropoiesis is supported mainly by liver but also splenic iron, in Pfn2−/− mice erythropoiesis is supported exclusively by the spleen, where we have detected a substantial increase in ferroportin (Fpn1) production. In Pfn2−/− mice hepcidin (Hamp1), production in liver is inappropriately normal despite low-iron levels, which should downregulate hepcidin production in order to increase dietary iron absorption and restore liver iron content. Hepcidin inappropriately normal levels in liver of Pfn2−/−mice are caused by a mild increase in the release of Il6 proinflammatory cytokine that can overrule opposite inhibitory signals.
Although iron accumulates in the brain of Pfn2−/− mice, we were surprised to observe a substantial depletion of the liver iron stores. Although microarray data did not reveal major alterations in this tissue, we observed upregulation of genes involved in liver uptake of extracellular iron that could likely be a compensatory mechanism to reestablish hepatic iron stores. The liver iron content of Pfn2-null mice is deficient in the context of unchanged spleen and duodenal iron levels as well as normal red blood cell counts and serum iron parameters. Hence, it cannot be explained by the classical mobilization of the hepatic iron stores in conditions of anemia. Future work is needed to elucidate this phenomenon.
Our hepatic expression analysis revealed a contradictory situation in low-iron-stores condition: Bmp6 levels were low, whereas Hamp1 transcript levels were not decreased. Our microarray and qPCR data in liver and our plasma Il6 measurements indicate a mild chronic systemic inflammation in Pfn2−/− mice. As the absence of Pfn2 is known to increase neurotransmitter release,24 it is possible that it affects similarly the release of cytokines produced in different tissues. Therefore, the observed reduction in hepatic Bmp6 mRNA expression and the increased levels of Il6 may act as antagonistic signals, maintaining an overall stable Hamp1 expression.
Spleen non–heme iron content and size were found unchanged in Pfn2−/− mice. Nevertheless, ferroportin expression was increased in spleens of Pfn2−/− mice. Because hepcidin negatively regulates membrane ferroportin levels, it is conceivable that increased ferroportin expression in spleen serves to stabilize its membrane presence in order to compensate hepatic iron deficiencies and sustain hematopoiesis, as Pfn2−/−mice are not anemic (Figure 7).
Our work highlights that altering the expression of a key regulator of membrane trafficking and endocytosis pathways such as Pfn2 alters iron metabolism at the cellular level and affects body iron homeostasis, similarly to defects in other endosomal sorting proteins, such as Snx3,49 or Sec15l1.50 In summary, our studies indicate that Pfn2 is a previously unrecognized critical player in iron homeostasis, which could contribute to human disorders of iron metabolism.
The online version of this article contains a data supplement.
The publication costs of this article were defrayed in part by page charge payment. Therefore, and solely to indicate this fact, this article is hereby marked “advertisement” in accordance with 18 USC section 1734.
Acknowledgments
The authors thank Dunja Ferring-Appel for excellent technical assistance with serum iron parameter measurements, Anke Carstensen from the Institut für Klinische Chemie und Klinische Pharmakologie, Universitätsklinikum Bonn for performing the blood analyses on the mice, Lara Nonell from the Microarray Analysis Service of the Hospital del Mar Medical Research Institute for support with microarray analysis, and Mar Mallo and Francesc Sole from the Affymetrix Microarray Platform of the Josep Carreras Leukaemia Research Institute for microarray performance. The authors acknowledge the facilities and the scientific and technical assistance of Cristina Patiño, Rocío San Andrés, and Javier Bueno from the TEM service at Centro Nacional de Biotecnología and M. Puerto Morales from Instituto de Ciencia de Materiales de Madrid, Madrid, Spain for continuous support.
This work was supported by grant SAF2015-70412-R from the Spanish Secretary of Research, Development, and Innovation (Ministerio de Economía, Industria y Competitividad [MINECO]) and grant DJCLS R14/04 from Deutsche José Carreras Leukämie Stiftung, grant 2014 SGR225 (Grups de Recerca Emergent, from Generalitat de Catalunya) from Generalitat de Catalunya, and financial support from Fundació Internacional Josep Carreras and from Obra Social “la Caixa” Spain (M. Sanchez). All work on the Pfn2 KO mouse model was supported by the Deutsche Forschungsgemeinschaft grant SFB1089 and SPP1464 (W.W.). S.L. was supported by the EMBO Short Term Fellowship ASTF 301-2013 for her work on the Pfn2−/− mice at the Institute of Genetics, University of Bonn, Bonn, Germany.
Authorship
Contribution: M. Sanchez and P.P.B. designed and performed research, analyzed the data, and wrote the manuscript; L.G. and B.G. provided reagents and samples, analyzed the data, and wrote the manuscript; M.W.H. and W.W. provided reagents and analyzed the data; and S.L., L.G., M. Shvartsman, M.R., J.C., and A.D.P. performed research and analyzed the data.
Conflict-of-interest disclosure: The authors declare no competing financial interests.
The current affiliation for L.G. is Analytical Chemistry Department, Institute of Nanoscience of Aragon, Universidad de Zaragoza, Zaragoza, Spain.
The current affiliation for M. Shvartsman is European Molecular Biology Laboratory, Monterotondo, Italy.
Correspondence: Mayka Sanchez, Josep Carreras Leukaemia Research Institute, Campus ICO–Germans Trias i Pujol, Crta Can Ruti Cami de les Escoles s/n, Badalona, 08916 Spain; e-mail: msanchez@carrerasresearch.org; and Pietro Pilo Boyl, Institute of Genetics, University of Bonn, Karlrobert-Kreiten-Str 13, 53115 Bonn, Germany; e-mail: pietro.piloboyl@uni-bonn.de.

This feature is available to Subscribers Only
Sign In or Create an Account Close Modal