Abstract
Introduction. Iron overload-related heart failure is the principal cause of death in transfused Thalassemia Major (TM) (Modell B, Cardiovasc Magn Reson 2008;10:42-48). Iron toxicity is dose dependent so a strategy of chelation therapy titration (Kirk P, Circ 2009;120:1961-1968) before the onset of left ventricle (LV) impairment changes outcomes (AlpenduradaF, Eur Heart J. 2010; 31:1648-54). The presence of iron in tissue detectably changes the magnetic properties of water, T1, T2 and T2*, as validated against tissue in animal and human models (Carpenter JP, Circ 2011;14:1519-28). T2*, the most used technique, is susceptible to non-iron influence (susceptibility artefact) and has low accuracy for high and low iron levels (Carpenter JP, J Cardiovasc Magn Reson. 2014;12:16-62). T1 mapping could complement T2* as it appears to have superior reproducibility and to detect mild iron missed by T2* (Abdel-Gadir A. J Cardiovasc Magn Reson. 2015;17(Suppl1):P312. Sado DM, J Magn Reson Imaging. 2015;41:1505-11), but studies to date have been small and not using state-of-the-art sequences.
Methods. In a prospectively single centre study of 138 TM patients and 32 healthy volunteers (HV) (no known medical conditions, normal CMR scan), we compared T1 mapping (Modifier Lock Locker Inversion sequence - MOLLI - Siemens Works in progress 448B) to the gold-standard dark (DB) and bright (BB) blood T2*, acquired on an Avanto 1.5T (Siemens Healthcare, Erlangen, Germany). For both T2* sequences, a single 10mm mid-ventricular short axis slice was imaged at 8 echo-times (2.58ms to 18.19ms, increment 2.23ms), flip angle=20¡, FOV read/phase=400mm/56,3%. The same slice was used for T1 images (thickness 6mm, distance factor=67%, FOV read/phase=360/75%, TR=740, TE=1.13, with motion correction for the in-line map generation).
Results and discussion.All participants provided informed consent.
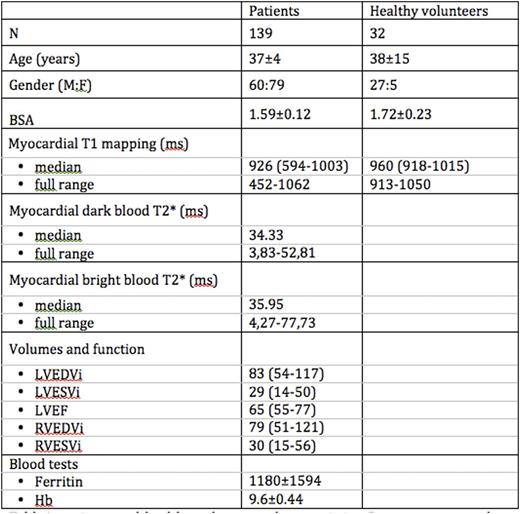
Table1 illustrates patients' and HV's details.
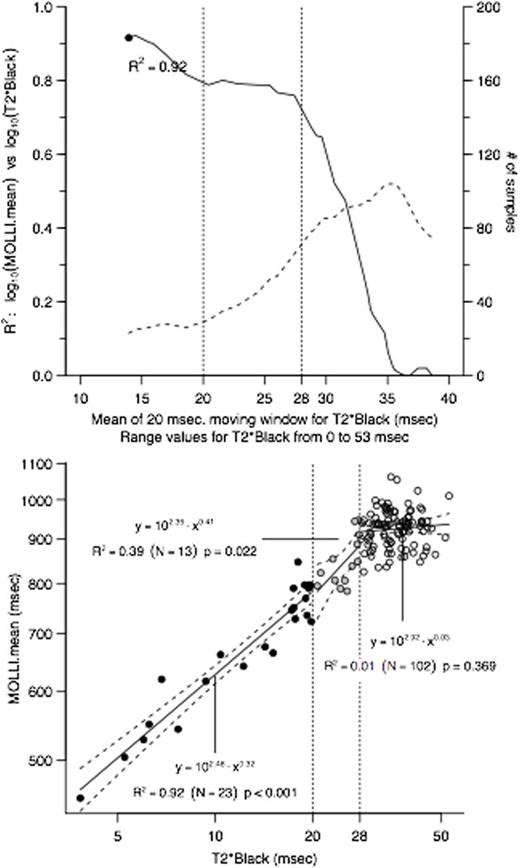
T2* was defined normal under the cutpoint value of 20ms. T1 normal range, defined by the HV cohort was 918-1015ms (the 2.5-97.5 quantiles with CI 95%). For DBT2*<20ms, both BBT2* and T1 mapping were broadly indistinguishable from DBT2* (DBT2* vs BBT2* R2=0.95; DBT2* vs T1 R2=0.92; all p<0.001). All subjects with low DBT2* (n=24, 17.4%) had low T1; 52 patients had normal DBT2* but low T1 mapping, i.e. 38% patients were reclassified from normal to iron loaded by T1. The relationship between DBT2* and MOLLI was described by a log-log linear regression (R2=0.80, p<0.001). Upper panel of Fig1 shows T1 vs DBT2* correlation over a 20ms window as the window moves by 1ms at a time on X-axis (so at X-axis point 'n', the Y-value is the R2 of the correlation of DBT2* vs T1 over the range n-to-n+20ms). As shown by lower panel of Fig1, three domains can be observed: strong relationship in the T2*=0-20ms range (R2=0.92, p<0.001); good relationship in the 21-28ms range, where the curve depicts a plateau (R2=0.80-0.77, p<0.001) and no relationship above 28ms. Given the conservative approach used to set T2* normality as above 20ms (Carpenter JP, Circ 2011;14:1519-28), the evidence that T2* SD values increase even for borderline T2* mean values (~20ms) (Anderson LJ, Eur Heart J. 2001;22:2171-9), and that 39% of normal T2* subjects have a low T1, we support prior suggestions that T1 is detecting mild iron in most of the subjects with DBT2*=20-28ms, missed by T2* as the threshold has had to be set too low for sensitivity reasons (Sado DM, J Magn Reson Imaging. 2015;41:1505-11). T1 mapping is thus a useful complementary tool to T2* both for clinical and research purposes. The reported reproducibilities of T1 square for power calculations and would translate into 6.25 to 49 times more power in studies to detect iron change (Alam MH, J Cardiovasc Magn Reson. 2015;24:17-102). Colour maps make iron instantly visible and add a confirmation step. Whether mild iron missed by T2* is important is unclear. In our cohort, 24-months follow-up was available for 9 patients with normal DBT2* and low T1. Although no statistical consideration is possible due to the small number, in those patients an increase in LV end diastolic volume was observed (from 78±18ml to 84±15ml), suggesting possible cardiotoxicity of even mild amount of iron. Further work is needed, especially in frail cohorts like children starting chelation and around pregnancy.
Moon:gsk: Consultancy; Genzyme: Research Funding; Shire: Membership on an entity's Board of Directors or advisory committees. Cappellini:Novartis: Membership on an entity's Board of Directors or advisory committees; Genzyme-Sanofi: Membership on an entity's Board of Directors or advisory committees; Celgene: Membership on an entity's Board of Directors or advisory committees.
Author notes
Asterisk with author names denotes non-ASH members.


This feature is available to Subscribers Only
Sign In or Create an Account Close Modal