Abstract
Introduction
SF3B1 hotspot mutations are associated with various cancers like uveal melanoma, chronic lymphocytic leukemia and myelodysplastic syndrome with ring sideroblasts (MDS-RS). These mutations affect RNA splicing by the use of alternative branchpoints resulting in an aberrant 3' splice site (ss) selection. RNA-sequencing (RNA-seq) analyzed to quantify exon-exon junctions identified aberrantly spliced transcripts in target genes, and half of them are predicted to be degraded by non-sense mediated decay. For this reason, target genes in SF3B1-mutated MDS remain partially characterized. In the present study, we performed deep RNA-seq analysis of bone marrow mononuclear cells in low/int-1 MDS with SF3B1 mutations to identify aberrant/cryptic splicing events among up or down-regulated gene sets.
Methods
SF3B1MUT MDS (n=21) were compared to 6 SF3B1WT cases and 5 controls. Analysis of RNA-seq read count was performed using the Voom method associated with the Limma empirical Bayes analysis pipeline (https://genomebiology.biomedcentral.com/articles/10.1186/gb-2014-15-2-r29). Up or downregulated gene sets were identified using Gene Set Enrichment Analysis (GSEA, false discovery rate<0.1). Gene expression profiling data (Affymetrix Hu2.0) were also available for 26/27 patient samples. TopHat (v2.0.6) was used to align the reads against the human reference genome Hg19 RefSeq (RNA sequences, GRCh37) downloaded from the UCSC Genome Browser (http://genome.ucsc.edu). Read counts for splicing junctions from junctions.bed TopHat output were considered for a differential analysis using DESeq2. Only alternative acceptor splice sites (two or more 3′ss with junctions to the same 5′ss) and alternative donor splice sites (two or more 5′ss with junctions to the same 3′ss) with P-values ≤10−5 (Benjamini-Hochberg) and absolute Log2 (fold change) ≥1 were considered.
Results
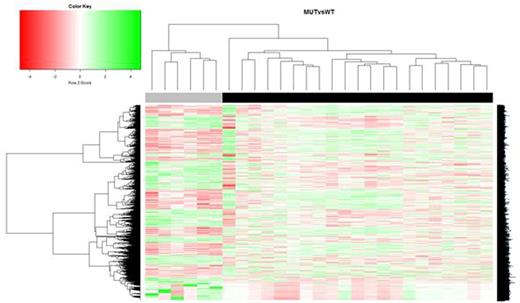
Principal component analysis (PCA) nicely discriminated controls from patients, and patients according to the presence of a SF3B1 mutation. A set of 6971 genes was differently expressed (P- value<0.05) between SF3B1MUT and SF3B1WT cases and allows unsupervised clustering in two separated groups (Fig. 1). Distinct gene sets also discriminated SF3B1MUT or SF3B1WT from controls.
Consistent with increased amount of erythroblasts in MDS-RS bone marrows, a set of erythroid genes including several genes involved in hemebiosynthesis pathway (ALAD, UROS, ALAS2, UROD) was significantly enriched in SF3B1MUT samples. Genes selected for their involvement in the core iron-sulfur cluster mitochondrial machinery (FXN, BOLA3, FDXR, GLRX5, ISCA2, NFS1, ISCU), the iron binding and trafficking (SLC25A38, ABCB10, TFR2, SLC25A37, ABCB6, FAM132B, SLC25A39, FTH1) and the cellular iron homeostasis (ACO1, ACO2, GLRX3) were also significantly enriched (FDR<10% and nominal P-value<0.05) when input in GSEA. Moreover, other enriched gene sets were G2M checkpoint, MYC targets, oxidative phosphorylation and E2F targets. All of these observations were similarly obtained when analyzing Affymetrix data. Furthermore SF3B1MUT samples with a K700E substitution harbored a specific pattern of deregulated genes, which allowed the ordering of SF3B1MUT samples according to the type of substitution.
As previously reported by AlsafadiS et al (2016), analysis of splice junctions using DESeq2 revealed an overall high level of differences between SF3B1MUT and SF3B1WTsamples. Among more than 540 differentially spliced junctions, more than 80% involved an aberrant acceptor (3'ss) site. As determined by PCA, the top 50 genes associated with relevant aberrant junctions were linked to iron metabolism or erythropoiesis and differentially expressed between SF3B1MUT and SF3B1WTsamples.
Conclusion
In this study, we combined robust analyses of gene expression and aberrantly spliced transcript expression in MDS with SF3B1 mutation. By comparing SF3B1MUTversus SF3B1WT samples, we identified a set of deregulated genes in which both normally and aberrantly spliced transcripts were detected that could contribute to the physiopathology of MDS-RS.
Hierarchical clustering and heatmapshowing differentially expressed genes (P-value<0.05) between SF3B1MUT (n=21, black) and SF3B1WT samples (n=6, grey) Ref. Alsafadi S et al. Nat Commun. 2016 Feb 4;7:10615.
Hierarchical clustering and heatmapshowing differentially expressed genes (P-value<0.05) between SF3B1MUT (n=21, black) and SF3B1WT samples (n=6, grey) Ref. Alsafadi S et al. Nat Commun. 2016 Feb 4;7:10615.
No relevant conflicts of interest to declare.
Author notes
Asterisk with author names denotes non-ASH members.


This feature is available to Subscribers Only
Sign In or Create an Account Close Modal