Abstract
Introduction: Endothelin-1 (ET1) is as a potent vasoconstrictor and mediates oxidative stress and inflammatory responses in various disease states. ET1 levels are elevated in individuals with physiologic measures of endothelial dysfunction. Further, urinary ET1 levels correlate with microalbuminuria in patients with sickle cell disease (SCD) suggesting ET1 mediates sickle cell nephropathy. We hypothesized that ET1 would be elevated in SCD patients with albuminuria and would correlate with endothelial dysfunction as measured by ultrasound imaging of the brachial artery.
Methods: Subjects with sickle cell anemia (HbSS) were evaluated in non-crisis, “steady-states.” Individuals on hydroxyurea or renin-angiotensin-aldosterone system blocking agents (such as ACE-inhibitors) had to be on stable doses for at least 3 months. Spot urine samples were obtained for albumin-to-creatinine ratio (UACR) over 2-3 visits. Hematologic measures were obtained at baseline. At last visit, plasma ET1 levels were drawn, subjects provided 24hr urine collections, and endothelial function was assessed by brachial artery shear stress methods. We obtained ultrasound measures of flow-mediated dilation (FMD) and nitroglycerin-mediated dilation (NTMD), as indices of endothelium-dependent and endothelium-independent vasodilation, respectively. Hyperemic flow was quantified as the velocity-time integral (VTI), a reflection of small vessel endothelial function. ET1 levels were compared by categories of albuminuria (normal, micro- (>=30, <300 mg/g), macro- (>=300 mg/g) by Kruskal-Wallis testing. We examined Spearman's correlations for ET1 and covariates of interest.
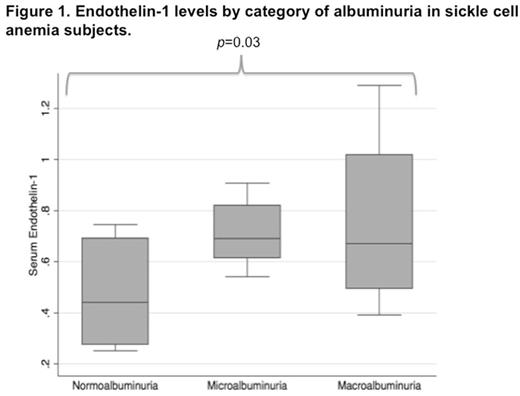
Results: 24 subjects had measures of plasma ET1 available with mean age 43.0 (SD 11.9) years; 11 (45.8%) were male and 17 had albuminuria (9 micro-, 7 macro-). Other covariates are presented in Table 1. Median ET1 levels were significantly higher in micro- (0.69 pg/ml; IQR 0.62, 0.82) and macroalbuminuria (0.67 pg/ml; IQR 0.49, 1.02) subjects compared to normoalbuminuria (0.39 pg/ml; IQR 0.28, 0.58) subjects (p =0.03) (Fig 1). ET1 also correlated with UACR in continuous measures (ρ=0.44; 95% CI 0.05, 0.72; p =0.03). We saw no correlation between ET1 and hematologic indices or hemolysis markers including hemoglobin level, WBC and platelet counts, LDH, indirect bilirubin, or HbS or HbF content. In measures of endothelial dysfunction, ET1 had a negative correlation with FMD (ρ= -0.34, 95% CI -0.65, 0.08; p =0.1) that was not statistically significant. However, there was a strong negative correlation between ET1 and hyperemic VTI (ρ= -0.56, 95% CI -0.80, -0.18; p =0.008).
Conclusions: In HbSS subjects, plasma ET1 levels associated with the presence of micro- or macroalbuminuria and also correlated with continuous measures of albuminuria. High ET1 levels correlated strongly with lower values of hyperemic VTI, indicating small vessel endothelial dysfunction. This latter finding may reflect glomerular capillary dysfunction leading to albuminuria. Our findings suggest ET1 plays a role in the pathogenesis of early kidney disease in HbSS as reflected by albuminuria and mediated by endothelial dysfunction.
Demographic and clinical data in 24 patients with HbSS.
| . | Normoalbuminuria (n=8) . | Microalbuminuria (n=9) . | Macroalbuminuria (n=7) . |
|---|---|---|---|
| Age (yrs) | 38.8 (9.9) | 42 (13.8) | 49.1 (10.1) |
| Male (N, %) | 2 (25.0) | 5 (55.6) | 4 (57.1) |
| SBP (mmHg) | 107.5 (96, 117) | 120 (117, 145) | 138 (117, 151) |
| DBP (mmHg) | 57 (52, 65) | 63 (56, 67) | 81 (63, 83) |
| Hemoglobin (g/dl) | 9.3 (8.3, 10.0) | 8.8 (7.5, 9.2) | 8.8 (8, 9.5) |
| WBC (109/L) | 6.9 (5.6, 8.5) | 7.0 (5.8, 10.6) | 8.1 (4.8, 11.2) |
| Platelet (109/L) | 351 (306, 556) | 288 (224, 374) | 356 (253, 445) |
| LDH (U/L) | 736 (580, 1031) | 1068 (771, 1389) | 907 (759, 998) |
| Indirect Bilirubin (g/dl) | 2.1 (0.9, 4.8) | 2.4 (1.2, 3.1) | 2.3 (1.6, 4.1) |
| Creatinine (mg/dl) | 0.58 (0.55, 0.76) | 0.68 (0.66, 0.98) | 0.70 (0.54, 1.35) |
| eGFR (ml/min/1.73m2) | 121.9 (109.8, 153.7) | 118.6 (78.4, 145.2) | 127.4 (63.0, 136.8) |
| 24hr CrCl (ml/min/1.73m2) | 129 (89, 203) | 101 (77, 116) | 80 (53, 124) |
| UACR (mg/g) | 8.8 (5.1, 11.2) | 95.8 (48.6, 142.7) | 518.9 (398.6, 706.7) |
| 24hr Urine Protein (mg) | 93 (72.5, 106) | 207 (140, 216) | 910 (506, 1388) |
Archer:Global Blood Therapeutics: Consultancy.
Author notes
Asterisk with author names denotes non-ASH members.


This feature is available to Subscribers Only
Sign In or Create an Account Close Modal