Abstract
Introduction:
Cirrhosis of liver due to chronic hepatitis B and/or C is a significant health care burden globally. Thrombocytopenia is one of the significant co-morbid conditions associated with cirrhosis. Splenomegaly had been pointed as one of the main factors behind thrombocytopenia in multiple studies. Another important aspect of this clinical condition is its high economic impact in the national health care budget. In this study, we re-evaluated the relation between thrombocytopenia, MELD score and spleen size in liver cirrhosis associated with chronic hepatitis B and/or C. We also evaluated the impact of these 3 factors over readmission of the patients at 30 and 90 days.
Method:
In this retrospective study, the medical records of patients admitted to Saint Joseph Hospital, Chicago, IL between January 1st, 2005 and December 31st, 2010 were queried for a discharge diagnosis of Chronic liver disease due to Hepatitis B and/or C.
Result:
Data Summary
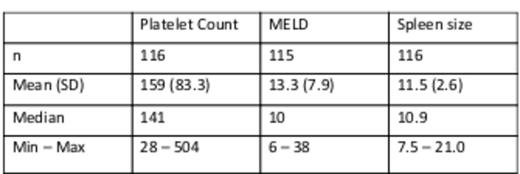
To examine the relationship between the biomarkers, scatter plot was generated for visual inspection. There was no apparent relationship between platelet count and MELD or spleen size. Correlation analysis by Spearman method showed a weak negative correlation between platelet count and MELD score (P=0.0051, coefficient = -0.26).
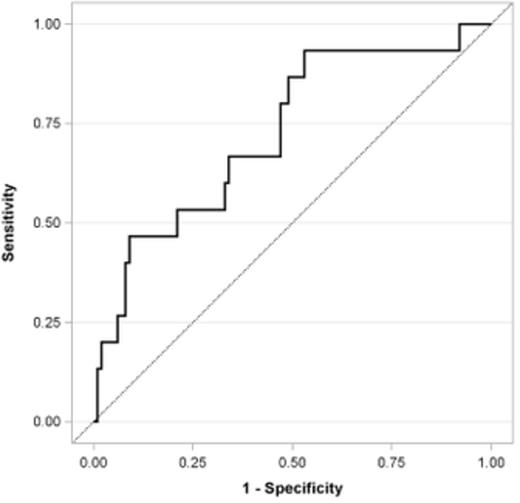
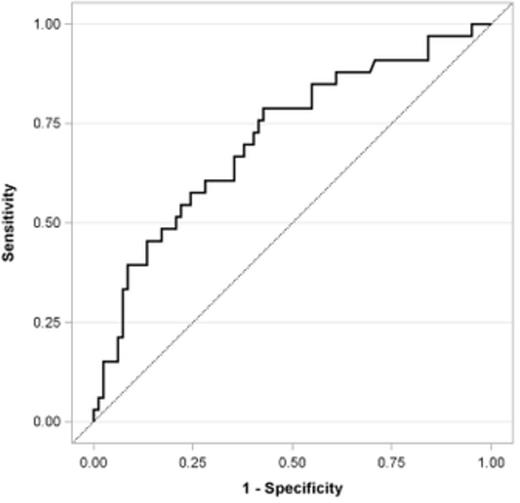
To predict the probability of re-admission by the biomarkers, logistic regression was used to select significant predictors. From univariate analysis, only MELD was a significant predictor in 30-day re-admission (P=0.012, AUC=0.665). For 90-day re-admission, both MELD (P=0.0034, AUC=0.691) and platelet count (P=0.030, AUC=0.647) were significant predictors in univariate analysis.
Summary
In this study, all subjects have chronic liver disease due to viral infection. Platelet count is not related to MELD score or spleen size in these hepatitis B, C, or B/C patients. The combination of MELD, platelet count, and spleen size fairly predicts 30-day re-admission occurrence with an AUC of 0.726.
Discussion:
Thrombocytopenia is a common hematological complication in patient with chronic liver disease. The mechanism of thrombocytopenia classically is thought to be caused by pooling and destruction of platelets within the enlarged spleen. Other proposed mechanisms are impaired platelet production in the bone marrow, production of inhibitors of platelet production in the spleen, and decreased platelet growth factor thrombopoietin production from liver as well as increased degradation of thrombopoietin by platelets sequestered in the congested spleen. A recent study showed that in more severe chronic hepatitis due to hepatitis-c virus where severity was assessed with Child-Pugh score, both mature and premature platelet counts are low and this inverse relation also correlates with platelet growth factor thrombopoietin level which is low in more severe liver disease. Since Child-Pugh scoring system has some degree of limitation due to subjective variation, we decided to use MELD score for our patients to assess the severity of the chronic liver disease.
Our study interestingly showed no correlation between platelet count, MELD score and spleen size. Study revealed only MELD was a significant predictor in 30-day re-admission (P=0.012, AUC=0.665). For 90-day re-admission, both MELD (P=0.0034, AUC=0.691) and platelet count (P=0.030, AUC=0.647) No correlation was observed even when cohorts were broken down into separately for male and female, for patients below and above 62 years old (the median age), and for each hepatitis subtype. 30-day re admission was clearly not related Platelet count or spleen alone but in combination they were linearly related to 30 and 90 day readmission.
This study was important for multiple reasons. Firstly, 30 day readmission was calculated to be 16% and 90 day readmission was found to be 29% including the 16% from 30-day readmission. Surprisingly MELD alone was not a good predictor for 30 day readmission, but in combination with other parameters Spleen size and platelet count, predictions were fairly accurate.
No relevant conflicts of interest to declare.
Author notes
Asterisk with author names denotes non-ASH members.


This feature is available to Subscribers Only
Sign In or Create an Account Close Modal