Abstract
The HCT-comorbidity index (CI) was developed as a measure of health-status that could stratify risks of mortality after HCT. Information are lacking on the possible biologic tissue-specific process that underlies the association between pre-transplant comorbidities and post-transplant mortality. Further, there is a continuously increasing need for novel biomarkers that could increase the magnitude of objectivity in diagnosing pre-HCT comorbidities and increase the predictive power for post-HCT NRM. MiRs are a class of small non-coding RNAs (~22 nt) that negatively regulate gene expression. Studies have uncovered the functional role of miRs in diverse pathophysiological processes. Moreover, a single miR could be implicated in different pathological processes. To this end, we analyzed miRs as diagnostic for relevant comorbidities before and as prognostic for mortality after HCT.
Peripheral blood mononuclear cell samples were previously collected from 36 pts within 30 days prior to HCT as a part of research repository. All samples were collected in EDTA tubes and processed and frozen at -80 Celsius degrees within 8 hours of draw. All pts were in CR before HCT. Patients were divided into two risk groups: low-risk included those with HCTCI score of 0 before HCT, who survived allogeneic HCT per last-follow up; while the high-risk group included those with HCT-CI scores of ≥4, who deceased after allogeneic HCT (Table).
RNA was isolated from PBMC using previously described methods (Xie LN et al, Clinical Transplant. 2014; 28:314). For discovery of relevant miRs, we used NanoString nCounter miR assay as previously described (Knouf EC et al, 2013. PLoS ONE 8: e69630) comprising 654 endogenous miRs. Analysis of miR raw data was done using nSolverTM 2.0 Software (NanoString Technologies, Inc.) applying standard quality control tests. All samples contributed to the discovery analysis. MiRs were filtered to include only those expressed with at least 50 counts for the NanoString abundance analyses. MiR raw data was normalized using the geometric mean of top 100 miRs (probes with highest 100 counts) as recommended by the manufacturer. Fold change was calculated with partitioning by the low vs high-risk groups computing two-tailed t-test on the log transformed normalized data that assumes unequal variance. We used p-value cut-off of <0.1 to identify relevant miRs. Heat-map analysis used z-score transformation on samples computing Spearman correlation of the median between samples. Differences between the adjusted mean levels of expressions comparing low vs high risk groups were generated from a linear regression model after adjusting for age, diagnoses, disease status, conditioning intensity, donor, gender, and race.
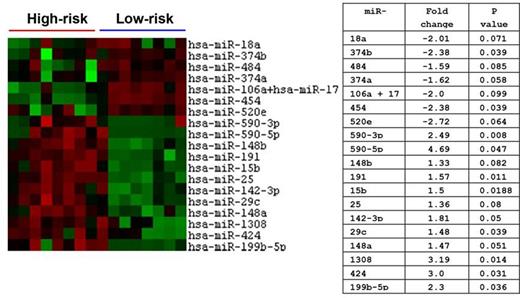
Among 654 tested miRs, 19 met the significance level of p<0.1. Among those 19 miRs, 7 were under-expressed and 12 were over-expressed among the high vs low risk group (Figure). Agglomerative cluster "heat-map" analysis of 16 samples representative of both groups is shown in Figure. In a linear regression model, only 7 miRs maintained statistical significance differences between the two risk groups; 2 were under-expressed (miR 374b and miR 454) and 5 were over-expressed (miR 142-3p, miR 109, miR 29c, miR 424, and miR 590-3b). This set of 7 miRs have been previously reported to predict the burden of some cardiac, pulmonary, hepatic, renal, psychiatric inflammatory bowel, obesity, infectious, diabetic, central nervous system, autoimmune and rheumatologic comorbidities.
We identified a group of MiRs as diagnostic biomarkers for relevant pre-transplant comorbidities and as prognostic biomarkers for post-transplant mortality. Comparing the predictive power of a clinical comorbidity index to that of the combined model of 7 miRs in a large dataset is underway. We will also investigate gene associations with these 7 miRs and how they predict specific post-HCT morbidities. Our results promise objectively accurate assessment of transplant risks and could also pave the way to potential interventions to lessen risks of mortality after allogeneic HCT.
Pt characteristics
| Characteristics . | . | Low risk (n=18) . | High-risk (n=18) . |
|---|---|---|---|
| Age (median, range), years | 44 (22-70) | 54 (24-68) | |
| % | |||
| AL | Myeloid | 78 | 67 |
| Lymphoid | 22 | 33 | |
| CR | First | 67 | 61 |
| Second | 33 | 39 | |
| Conditioning | High-dose | 50 | 39 |
| Reduced-intensity | 50 | 61 | |
| Donor | Related | 17 | 28 |
| Unrelated | 83 | 72 | |
| Gender | Male | 50 | 50 |
| Female | 50 | 50 | |
| Race | White | 88 | 83 |
| Others | 12 | 17 | |
Maclean:NanoString Technologies: Employment. Roy:3NanoString Technologies: Employment.
Author notes
Asterisk with author names denotes non-ASH members.


This feature is available to Subscribers Only
Sign In or Create an Account Close Modal