Abstract
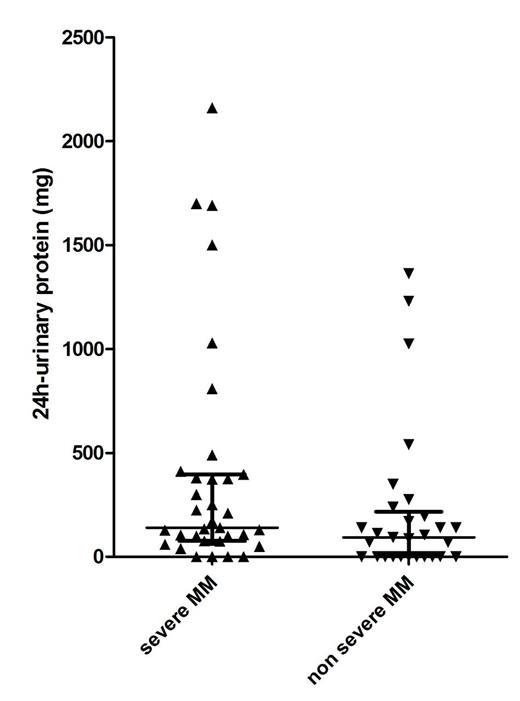
Introduction and aim of the study: monoclonal gammopathy of undetermined significance (MGUS) and smoldering multiple myeloma (SMM) have a distinct risk of evolving towards symptomatic multiple myeloma (MM) but it is widely accepted that they should not be treated until clinical evolution. The clinical presentation of symptomatic MM includes severe complications like acute renal failure, spinal cord compression by vertebral collapse, pathologic bone fractures which cannot be completely avoided even by strict follow-up of MGUS/SMM patients. The recent availability of effective and less toxic therapies has fueled renewed interest in the identification of prognostic models able to predict the risk of impending progression of MGUS/SMM patients to symptomatic MM and criteria for MM defining events have been recently broadened to allow an earlier start of treatment even in asymptomatic patients (Rajkumar SV et al, Lancet Oncol 2014). However, from a clinical perspective it would be more important to prevent the development of severe MM related complications by treating those MGUS/SMM considered at high risk of developing them. To this end, we have analyzed known risk factors for MGUS/SMM progression and other disease biomarkers in order to identify those able to consistently predict an high risk of "severe MM" development. Methods: we retrospectively analyzed 67 patients with symptomatic MM with a known previous history of MGUS/SMM, referred to our division from 1985 to December 2014 (23 males, 44 females; median age at MGUS/MM diagnosis 60 years). Focusing on the first assessment of their asymptomatic disease, we compared patients who subsequently developed severe CRAB criteria (Bladé J et al, Hematol Oncol Clin North Am. 2007), defined as having at least one of the following: hypercalcemia > 11.5mg/dL, creatinine > 4mg/dL, Hb < 8 mg/dL, severe bone lesions characterized by pathological fractures or causing spinal nerve compression, and called "severe MM" with patients who lacked severe CRAB symptoms at MM diagnosis, in order to identify risk factors for "severe MM" during its asymptomatic phase. Variables analyzed for comparison were: involved/uninvolved free light chains (FLC) ratio, monoclonal component (MC) quantification, presence of evolving pattern of MC (defined as an increase in the level of MC of at least 10% in 6 months), presence of immunoparesis, LDH levels, 24h-urinary protein levels, Ig isotype and bone marrow plasma cells percentage. Frequency of follow up was also considered (every 6 months or more). Time to treatment start (TTTS) from MGUS/SMM diagnosis, progression free survival (PFS) from first line treatment and overall survival (OS) were also calculated. Results: median 24-hour urine protein levels were significantly higher in MGUS/SMM patients who subsequently developed "severe MM", compared with patients without severe CRAB symptoms at MM diagnosis (140 vs 90mg/24h, p 0.022, see Figure 1), with an increased risk of severe myeloma related complications for MGUS/SMM patients with more than 200mg/24h urine proteins (Odds Ratio 2.65, p 0.037). Risk was highest in 4 MGUS/SMM patients with 24h-urinary protein levels higher than 1500mg (Odds Ratio 8.43, p 0.030) who invariably developed "severe MM". No difference were found comparing other variables. Of note, there was no difference between the two subgroups in terms of median TTTS (5.3 vs 8.3 years for MGUS patients and 1.7 vs 1.6 years for SMM, respectively), PFS ( 24.4 vs 32.2 months, respectively) and OS (nr vs 4.36), although a higher early mortality was observed in patients with "severe MM" (2 y OS 69% vs 93%).
Conclusions: increased 24h-urinary protein levels (> 200mg) in MGUS/SMM patients are associated with a higher risk of the occurrence of severe CRAB symptoms at MM progression. Further data with larger series of patients are needed to better define the best predictive threshold for "severe MM". However, patients with more than 1500mg/24h urinary protein loss represent a small subgroup of MGUS/SMM patients who should better start treatment while still asymptomatic.
24h-urinary protein (mg) levels in the asymptomatic phase
24h-urinary protein (mg) levels in the asymptomatic phase
No relevant conflicts of interest to declare.
Author notes
Asterisk with author names denotes non-ASH members.


This feature is available to Subscribers Only
Sign In or Create an Account Close Modal