Abstract
Introduction Accurate characterization of cerebral blood flow (CBF) in patients with sickle cell anemia (SCA) is imperative given the occurrence of neurovascular sequelae in this population. Arterial Spin Labeling (ASL) is a promising MRI modality that has been used to quantify CBF in SCA by several groups. Unfortunately, ASL quantification has proven challenging in SCA given the unique phenotype found in these patients including decreased hematocrit, elevated blood velocity an abnormal rheologic properties. As a result, there are conflicting accounts of ASL perfusion in this population. One of the key parameters of ASL quantification is the time between the labeling of spins in the neck and the downstream diffusion of those spins into parenchymal tissue, termed tissue transit time (TT). Delayed tissue TT is a known consequence of many neurovascular pathologies, including stroke. Given the elevated cerebral blood velocity and flow in response to anemia, however it is generally assumed that tissue TT is shorter in SCA but has yet to be studied. In order to improve ASL quantification and characterize this neurovascular biomarker we measured ASL derived tissue TT in healthy patients with SCA and ethnicity matched controls.
Methods All patients were recruited with informed consent or assent and this study was approved by the Children's Hospital
Los Angeles institutional review board. Exclusion criteria included pregnancy, previous stroke, acute chest, pain crisis or hospitalization within one month. All MRI scans were performed on an Achieva 3T scanner with an 8 channel head coil. Tissue TT was measured using two single shot, GRASE, ASL acquisitions, one with velocity spoiling gradients (venc 5 cm/s) and one without. Pseudo continuous ASL had a label duration of 1150ms and delay of 1500ms. Single slice phase contrast MRI of the carotids and vertebral arteries measured arterial blood velocity and global CBF. Hemoglobin level was determined on the day of the study.
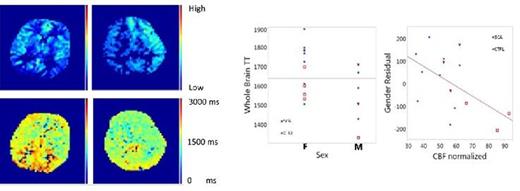
Results Eight patients with SCA (7 SS, 1 SC; 15.8 + 4.4yo; 5F, 3M) and nine ethnicity matched healthy controls (36.4 + 4.1yo; 6 F, 3M) were recruited. Patients with SCA had a lower hemoglobin levels (SCA, 10.1 + 0.64 g/dl, CTRL 13.7 + 0.58) and elevated CBF (SCA, 76.6 + 5.8 ml/100g/min, CTRL 49.0 + 4.4 ml/100g/min). Regional ASL perfusion asymmetries were observed in several SCA subjects. These asymmetries were not present in corresponding tissue TT maps (Figure 1). There was a trending difference in tissue TT between the two groups (SCA 1588 + 49.8, CTRL 1696 + 46.9 ms, p=.1). After multivariate analysis, sex and global CBF were the only predictors of tissue TT, r2=.54 (Figure 2).
Discussion Our data is the first of our knowledge to measure the tissue TT in patients with SCA. Tissue TT is distinct from the bolus arrival time or arterial TT which corresponds to the arrival time of tracer at the imaging region. Tissue transit time is more sensitive to microvascular flow and diffusion effects and may reflect microvascular health and blood brain barrier integrity. Our measurement of tissue TT is congruent with other findings in separate neurovascular pathologies and suggests that gender and global CBF must be considered when quantifying ASL perfusion. These preliminary results also offer insight into the perfusion asymmetries observed in the ASL SCA literature. We found that perfusion asymmetries do not correlate with tissue TT suggesting either 1) tissue TT is conserved despite differences in regional flow or 2) a separate source of error is leading to spurious regional perfusion quantification, ie labeling efficiency.
Relative perfusion map (top) vs transit time map (bottom) in a healthy control (left) and patient with SCA (right). Posterior region in healthy control demonstrates longer transit time. Right left perfusion asymmetry in SCA patient is not observed in corresponding transit map.
Univariate analysis of sex vs tissue TT (left). Males demonstrate shorter transit time than females. After correcting for gender there is an observed inverse flow effect where larger CBF corresponds to shortened tissue TT (right).
No relevant conflicts of interest to declare.
Author notes
Asterisk with author names denotes non-ASH members.


This feature is available to Subscribers Only
Sign In or Create an Account Close Modal