Abstract
Introduction
During initial diagnosis and therapy, patients with ALL can develop life-threatening complications such as sepsis, leukostasis, hemorrhage, and tumor lysis syndrome. Dedicated multidisciplinary leukemia teams may be needed to provide optimal management of such complications and selection of optimal therapeutic strategy. AH are more likely to have such expertise, adequate resources, standard operating policies and clinical trials, which may influence early mortality and OS. Such trends have been noted for other malignancies, such as lung cancer (Samson, Am Thorac Surg 2015 and Luchtenborg JCO 2013). In acute myeloid leukemia, OS may be better if patients are treated in a high-volume hospital (Giri Blood 2015). Whether OS of ALL differs based on the facility type remains unclear.
Methods
Using the NCDB Participant User File, we extracted patient-level data of patients with ALL reported between 1998 to 2012. Hospital facilities were classified as either AH (academic/research program) or NAH (community cancer program, comprehensive community cancer program, and other, as per NCDB classification). Patients, who received all of their first course treatment or a decision not to treat made at the reporting facility, were included. Subjects with complete and known data for the variables sex, age, race, education, income, distance traveled for health care, hospital type, facility location, urban/rural location, insurance, Charlson co-morbidity score, chemotherapy use, time from diagnosis to treatment initiation, use of hematopoietic stem cell transplant, 30-day mortality, last contact, and vital status were included. These variables were analyzed in a univariate analysis. Kaplan Meier curves were drawn and compared using log rank test. Multivariate analysis was performed using logistic regression for 30-day mortality and cox regression with backward elimination approach for OS. Statistical analysis was done using PC SAS version 9.4.
Results
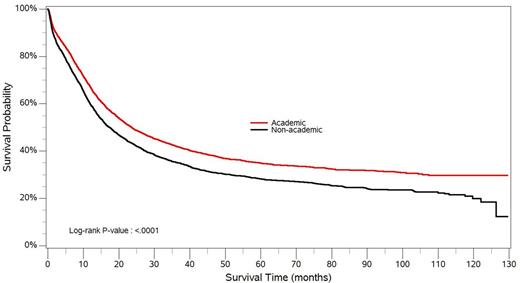
Of 9863 patients with ALL, 5710 (57.9%) were treated in AH. Patients treated at AH versus NAH were more likely to be African-Americans, uninsured and Medicaid insured, travel long distance to receive health care and receive transplant as a part of their treatment. The median OS (23 vs. 17 months) and 1-year OS (67% vs. 59%) were better in AH as compared to NAH (Figure 1). In a multivariate analysis, the 30-day mortality was significantly worse in NAH as compared to AH (odds ratio, OR 1.206; 95% confidence interval, CI 1.011-1.44; p <0.0374) (Table 1). Similarly, Cox regression showed that the OS was significantly worse in NAH as compared to AH (hazard ratio, HR 1.14; 95% CI 1.08-1.19; p <0.001) after adjusting for other covariates.
Conclusion
OS of patients with ALL may be improved, if patients receive initial therapy in AH. Possible explanations may include increased provider experience, enhanced multidisciplinary care, and access to clinical trials, among others. Improved understanding of such factors may provide opportunity to improve OS of patients treated at NAH.
Multivariate logistic regression of 30-day mortality
| Variable . | Odds ratio . | 95% confidence interval . | P value . |
|---|---|---|---|
| Academic (ref) Non-Academic | 1 1.206 | 1.01-1.44 | 0.0374 |
| Age - <60 years (ref) - > 60 years | 1 2.907 | 2.28-3.71 | <0.001 |
| Charlson comorbidity score -0 (ref) -1 - 2 or more | 1 1.47 2.13 | 1.18-1.82 1.57-2.88 | 0.0005 <0.0001 |
| Chemotherapy - Yes (ref) - No | 1 2.93 | 1.82-4.72 | <0.0001 |
| Days until first treatment | 0.927 | 0.91-0.94 | <0.0001 |
| High school education - 29% or more (ref) - 20%-28.9% - 14%-19.9% - Less than 14% | 1 0.82 0.88 0.63 | 0.63-1.06 0.69-1.14 0.49-0.81 | 0.13 0.34 0.0004 |
| Insurance Status - Private insurance/managed care (ref) - Not insured - Medicaid - Medicare - Other government | 1 1.46 0.80 1.61 0.45 | 1.04-2.05 0.57-1.12 1.26-2.06 0.11-1.84 | 0.03 0.20 0.0002 0.26 |
Kaplan Meier curve showing cumulative survival among ALL patients treated at AH versus NAH (p value of log rank test <0.001)
Kaplan Meier curve showing cumulative survival among ALL patients treated at AH versus NAH (p value of log rank test <0.001)
No relevant conflicts of interest to declare.
Author notes
Asterisk with author names denotes non-ASH members.


This feature is available to Subscribers Only
Sign In or Create an Account Close Modal