Abstract

Platelet function disorders (PFDs) are common in patients with mild bleeding disorders (MBDs), yet the clinical significance of laboratory findings suggestive of a PFD remain unclear due to the lack of evidence for a clear link between test results and patient phenotype. Herein, we present results from a study evaluating the potential utility of platelet function testing using whole-blood flow cytometry in a cohort of 105 patients undergoing investigation for MBD. Subjects were evaluated with a test panel comprising two different activation markers (fibrinogen binding and p-selectin exposure) and four physiologically relevant platelet agonists (ADP, PAR1-AP, PAR4-AP and CRP-XL). Abnormal test results were identified by comparison with reference ranges constructed from 24 healthy controls or the fifth percentile of the entire patient sample. We found that abnormal test results are predictive of bleeding symptom severity, and that the greatest predictive strength was achieved using a subset of the panel, comparing measurements of fibrinogen binding after activation with all four agonists with the fifth percentile of the patient sample (P = 0.00008, hazard ratio 8.7; 95 % CI 2.5-40). Our results suggest that whole-blood flow cytometry-based platelet function testing is a feasible alternative for the investigation of MBDs. We also show that platelet function testing using whole-blood flow cytometry could provide a clinically relevant quantitative assessment of platelet-related primary hemostasis.
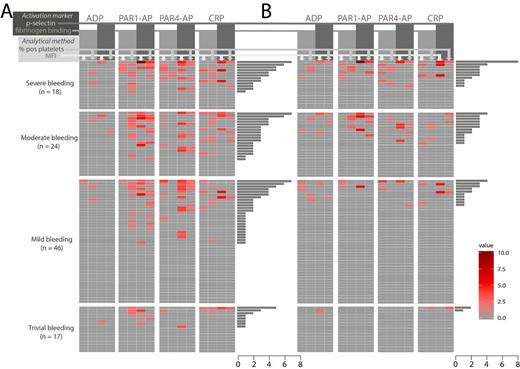
Test results for each patient in comparison with reference range (A) and the fifth percentile of the entire patient cohort (B). Normal test results are colored grey, abnormal test results are colored with a continuous color gradient using the deviation from the mean divided by the standard deviation as a measure of degree of abnormality. Grey horizontal bars illustrate the number of abnormal test results for each patient.
Test results for each patient in comparison with reference range (A) and the fifth percentile of the entire patient cohort (B). Normal test results are colored grey, abnormal test results are colored with a continuous color gradient using the deviation from the mean divided by the standard deviation as a measure of degree of abnormality. Grey horizontal bars illustrate the number of abnormal test results for each patient.
Lindahl:Diapensia: Equity Ownership.
Author notes
Asterisk with author names denotes non-ASH members.

This icon denotes a clinically relevant abstract


This feature is available to Subscribers Only
Sign In or Create an Account Close Modal