Abstract
Background: Innovative means to risk-stratify HSCT patients are needed. Previous studies in cancer patients suggest association between body composition and survival. However, this has not been previously described is allogeneic HSCT recipients. Furthermore, the correlation of body composition with pre- and post-HSCT physical activity in cancer patients remains undefined. We postulated that body composition prior to HSCT is associated with post-HSCT outcomes.
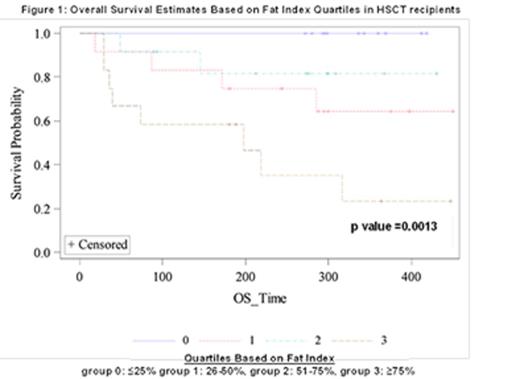
Methods: Patients who had completed pre-HSCT physical function assessment as part of ongoing prospective clinical trial were identified. Analysis of self-reported and measured physical activity and their association with outcomes after transplantation is currently ongoing. Regional CT at the 4th thoracic vertebra (T4) was obtained for post-hoc analysis of body composition within this cohort. Using Slice-O-Matic software V4.3 (Tomovision, Magog, Quebec, Canada), both adipose and muscle tissue were quantified to obtain the respective cross sectional area (cm2). Fat and skeletal muscle were identified and quantified within the following CT Hounsfield unit thresholds: -29 to +150 for skeletal muscle and -190 to -30 for adipose tissue. Tissue boundaries were manually corrected as necessary. Cross sectional areas were subsequently normalized for stature (height2) to obtain a tissue index for both fat and muscle (cm2/m2). For this analysis, fat index (FI) and muscle index (MI) were divided into quartiles (group 0: ≤25%, group 1: 26-50%, group 2: 51=75%, group 3: ≥75%). Statistical significance was defined as p < 0.05 and all analyses were done on SAS 9.3.
Results: All patients (n=50) enrolled on the pre-HSCT functionality trial between 02/2014 and 02/2015 were identified for this analysis. 3 patients were excluded for analysis: 2 subjects ultimately did not proceed to HSCT and 1 subject had a CT scan that was not evaluable. Thus, 47 subjects had evaluable data; baseline characteristics are summarized (Table 1). Median follow-up for survivors is 298 days (interquartile range (IQR): 272-368 days). Overall survival (OS) significantly differs between FI strata (log rank p value =0.0013) (Figure 1). MI is not associated with OS (p=NS). FI is inversely correlated with distance walked during 6-minute walk test pre-HSCT (r = -0.33, p = 0.027). FI and MI are not significantly associated with self-reported physical activity using the International Physical Activity Questionnaire (IPAQ) post-HSCT (day 1, 30, 90), or patient-reported quality of life (QOL).
Conclusions: These data provide the first evidence supporting an association between CT-defined cross sectional adipose tissue index and survival following HSCT. This non-invasive, routinely employed imaging modality may provide a new avenue for enhanced risk-assessment for HSCT patients. Subsequent studies will examine this effect in larger populations, with specific attention to other established prognostic variables.
Baseline Characteristics
| Variables . | N (%) . |
|---|---|
| Age, yrs (median, range) | 60 (24-75) |
| Gender, male | 30 (63.8%) |
| KPS ≥90 | 42 (89.3%) |
| HCT-CI≥3 | 29 (61.7) |
| Diagnosis § AML § ALL § CLL § CML § MDS § HD § MM § MPS § NHL | 12 (25.5%) 5 (10.6%) 3 (6.4%) 2 (4.3%) 9 (19.1%) 2 (4.3%) 3 (6.4%) 2 (4.3%) 9 (19.1%) |
| Conditioning Intensity, Myeloablative | 24 (51.1%) |
| Armand Disease Risk at HSCT § Low § Intermediate § High/Very High | 2 (4.3%) 26 (55.3%) 19 (40.4%) |
| Donor Type § Matched Related Donor § Matched Unrelated Donor § Mismatched Unrelated Donor § Double Umbilical Cord Blood | 13 (27.7%) 27 (57.4%) 6 (12.8%) 1 (2.1%) |
No relevant conflicts of interest to declare.
Author notes
Asterisk with author names denotes non-ASH members.


This feature is available to Subscribers Only
Sign In or Create an Account Close Modal