Abstract
Introduction: Recently introduced treatments have improved survival outcomes in relapsed or refractory multiple myeloma (rrMM), with positive outlooks from ongoing trials. However, evidence on relative effectiveness to inform best practice is lacking due to the paucity of head-to-head clinical trials. This systematic review aimed to compare all treatments in rrMM via a mixed treatment comparison (MTC), taking into account prior lines of therapy. Novel statistical techniques using a network meta-analysis (NMA) were developed to estimate relative effectiveness.
Methods: A literature search was conducted August 2014 and repeated December 2014. Randomised control trials (RCTs) were included if they reported median duration of progression-free survival (PFS), overall survival (OS) or time to progression (TTP) as a primary or secondary rrMM treatment outcomes. A Bayesian NMA using non-informative prior distributions was fitted in the software application R using JAGS. Such models allow for the estimation of all pairwise comparisons within a connected network of evidence. Fixed effects were assumed, as each direct comparison in the network is informed by a maximum of two trials, which does not allow for the estimation of a heterogeneity parameter. Considerable heterogeneity was observed across studies. In particular the number of prior treatment lines among patients recruited into trials in rrMM varied markedly and was often not reported in enough detail to include this potentially important variable in the analysis. As a result, trials conducted in heavily pre-treated patient populations (3 or more prior lines of therapy) were excluded from the primary analysis.
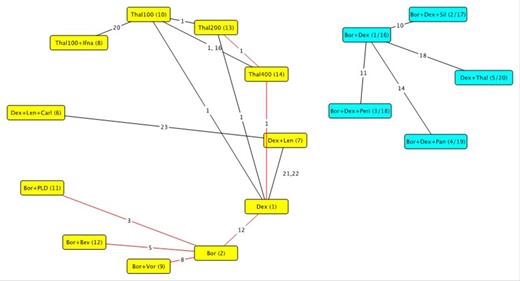
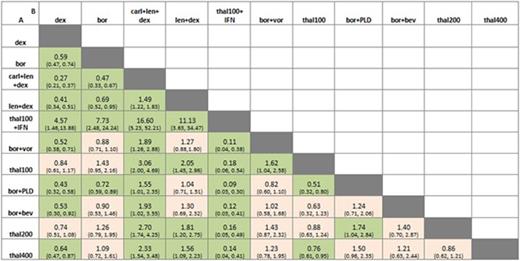
Results: A total of 24 RCTs reporting relevant outcomes for 20 different treatment regimens were identified for data extraction. It was not possible to link all 20 regimens within a single evidence network, but the majority (16) were incorporated within two networks (see figure 1). As a result, the analysis estimated all pairwise comparisons within each of the networks; it is not possible to draw conclusions for comparisons across networks. Results are presented in figure 2 for the yellow (larger) and blue networks (smaller).
Three studies were excluded from the presented analysis as median PFS had not yet been reached at follow up. Median follow up across all identified studies ranged from 5.59 to 36 months. Within the yellow network, carfilzomib in combination with lenalidomide and dexamethasone was the most effective treatment, followed by lenalidomide and dexamethasone and then bortezomib. In the smaller blue evidence network, bortezomib in combination with dexamethasone and panobinostat was the most effective treatment.
Discussion: Decision-making to optimise patient care, supported by clinical guidelines, requires evidence-based assessment of available treatments. In practise this is often restricted to a series of pair-wise comparisons of treatments such that drawing appropriate inferences across all available options is not possible. To our knowledge, the application of NMA and subsequent results presented here are the first of their kind in rrMM. Previous meta-analyses have been reported for individual treatments, but not for all available options. Our analysis appears broadly consistent with evidence from clinical trials for licensed treatments which are now the established standard of care in rrMM. One limitation of our analysis relates to the published evidence on prior treatment lines in rrMM patients. Fitting a meta-regression to explain heterogeneity may lead to confounding of the treatment effect given the available evidence. Patient level data would allow for a more reliable analysis of the effect of prior treatment lines on PFS. A further consideration is the level of evidence included within our analysis. NMA typically focuses on data drawn from RCTs though methods are available to allow for the inclusion of non-RCT evidence. A great deal of published evidence of this sort is available in the rrMM setting and future analytical approaches should explore how the inclusion of this evidence affects our findings.
Reduced RCT evidence network (red links for trials which not reporting OS outcomes)
Reduced RCT evidence network (red links for trials which not reporting OS outcomes)
Odds ratio and 95% credible intervals for pairwise comparisons A versus B. Significant differences shaded in green. Estimates below 1 favour drug A, estimates above 1 favour drug B.
Odds ratio and 95% credible intervals for pairwise comparisons A versus B. Significant differences shaded in green. Estimates below 1 favour drug A, estimates above 1 favour drug B.
Ruggeri:Cogentia UK: Research Funding. Maguire:Cogentia Healthcare Consulting: Research Funding. Cook:Celgene: Consultancy, Research Funding, Speakers Bureau; BMS: Consultancy; Sanofi: Consultancy, Speakers Bureau; Amgen: Consultancy, Speakers Bureau; Takeda Oncology: Consultancy, Research Funding, Speakers Bureau; Janssen: Consultancy, Research Funding, Speakers Bureau. O'Dwyer:Celgene: Honoraria, Research Funding.
Author notes
Asterisk with author names denotes non-ASH members.


This feature is available to Subscribers Only
Sign In or Create an Account Close Modal