Abstract
Introduction
The improvement in pediatric ALL survival rates observed since the 1970xs has been achieved through a series of carefully conducted randomized controlled, multi-institutional clinical trials. Alas, despite more precise risk stratification and widespread implementation of aggressive treatment protocols results in adults (including young adults) lag behind those in children. For example, a recent study estimated the overall 5-year relative survival of adult ALL patients diagnosed in 2002-06 in Germany and the United States (US) at 43.4% and 35.5%, respectively. While survival was better in younger patients, with 5-year relative survival ratios of 59.2% (Germany) and 54.9% (US) in patients aged 15-24 years, the lack of curative treatment for the majority of adult patients is obvious. In recognition of a recent shift of the treatment for younger adult ALL patients in Sweden, with increasing use of pediatric protocols up to age 45 as well as introduction of imatinib for patients with Philadelphia-positive ALL, we compared the overall and age specific relative survival of adult ALL patients in Sweden and the US Surveillance, Epidemiology and End Results (SEER) database with emphasis on temporal trends.
Methods
We used data from the SEER 9 database (which covers approximately 9% of the US population) and the nationwide Swedish cancer register to determine the survival of adults (aged 18-84) diagnosed with ALL in the period 1980-2011. To improve comparability with Sweden, the SEER data were restricted to whites (82% of all patients). We studied temporal trends in relative survival for four predefined age groups: 18-29, 30-44, 45-64, and 65-84 years at diagnosis. Relative survival was estimated using flexible parametric models with year of diagnosis modelled as a restricted cubic spline with 3 degrees of freedom. Separate models were fitted for Sweden and the SEER data, each containing age, year, and an age by year interaction. The effects of age and year were allowed to be non-proportional. Model goodness of fit was assessed by comparing the model-based estimates of relative survival to empirical (life table) estimates. Because patients diagnosed in 2010 could only be followed up until the end of 2011, the estimates of 5-year relative survival for these patients are based on statistical prediction. We therefore also compared 1-year survival, which could be directly estimated.
Results
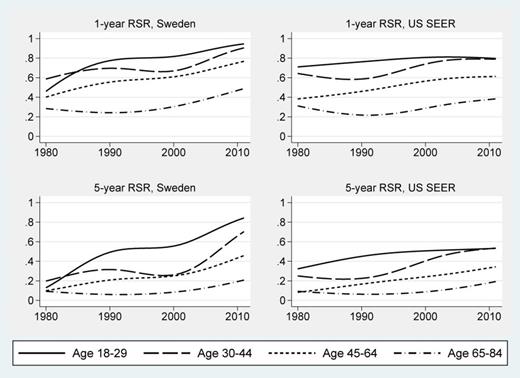
Our analysis included 3,539 and 1,391 patients with ALL in the US and Sweden, respectively. The mean ages were similar in the two countries, 48.1 (US) and 51.6 (Sweden); as was the distribution in the four age groups. In both countries we saw a trend towards better survival in patients diagnosed in recent years, as well as an age gradient with better relative survival for younger patients. However, a larger temporal improvement was noted in patients younger than 45 years at diagnosis in Sweden than in the US (p<0.05). Strikingly, in Sweden the 5-year RSR of patients aged 18-29 at diagnosis improved from 0.56 (95% CI, 0.43-0.66) for those diagnosed in 2000 to 0.82 (95% CI, 0.63-0.92) for those diagnosed in 2010. The corresponding estimates for the SEER data were 0.51 (95% CI, 0.44-0.57) and 0.53 (95% CI, 0.39-0.65) for patients diagnosed in 2000 and 2010, respectively. Similar results were seen for patients age 30-45 at diagnosis.
Conclusions
The survival of adult patients with ALL has improved gradually in both the US and Sweden during the past decades. The most dramatic improvement was seen in patients age 18-29 and 30-44 years diagnosed in the most recent years in Sweden, with 5-year relative survival of 82% and 66%, respectively. As we lack detailed clinical data including information on treatment and supportive care, we are unable to confidently identify what factors account for the important differences in survival between the two countries. However, the widespread and standardized implementation of a pediatric ALL protocol adapted for adults in Sweden seems a likely success factor.
One and 5-year relative survival ratios by year of diagnosis and age at diagnosis for Sweden and the US SEER data
Footnote: RSR denotes relative survival ratio; SEER denotes Surveillance, Epidemiology and End Results.
One and 5-year relative survival ratios by year of diagnosis and age at diagnosis for Sweden and the US SEER data
Footnote: RSR denotes relative survival ratio; SEER denotes Surveillance, Epidemiology and End Results.
No relevant conflicts of interest to declare.
Author notes
Asterisk with author names denotes non-ASH members.


This feature is available to Subscribers Only
Sign In or Create an Account Close Modal