Abstract
Background
Side population (SP) cells are known as enriched source of cancer initiating cells with stem cell properties. The SP cells show a distinct low-staining pattern with the Hoechst 33342 dye. Our aim was to identify SP cells in multiple myeloma (MM) cell lines as well as characteristics of SP cells. Furthermore, we investigated drugs that are effective against SP cells of MM.
Methods
SP (side population), MP (main population) cells from human multiple myeloma cell line (RPMI8226) were sorted by flow cytometry based Hoechst 33342 staining. We performed proliferative capacity in vitro, colony-forming cell assay, cell cycle analysis, drug toxicity (doxorubicin, dexamethasone, bortezomib, melphalan). Expression of stem cell markers (ABCG2, Oct4, Sox2, and Nanog) was observed by western blotting assay.
Results
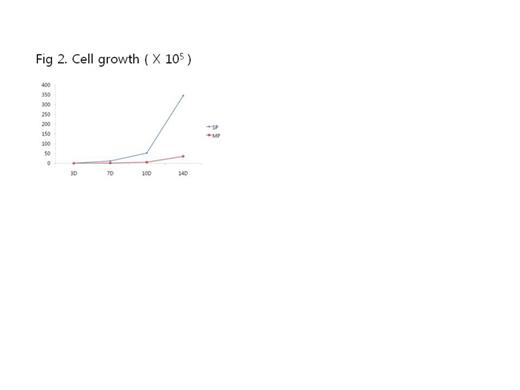
Several established studies have shown a clonogenic MM cell population with CD 138-status. Therefore, we assessed whether there is correlation between CD 138 - subpopulations and SP cells. CD 138- subpopulations of MM cell lines were not consistent with SP cells. And we have found no correlation between expression of CD 19, CD20, and CD 27 and the proportion of SP cells. No difference was observed for expression of stem cell marker between the SP cells and MP cells. We examined cell cycle analysis and proliferation ability of SP and MP cells. SP cells showed a capacity for higher proliferation abilities and clonogenecity than MP cells. (Fig1,2)
We investigated target SP cells with several drugs (doxorubicin, dexamethasone, melphalan, bortezomib). Importantly, bortezomib was the most effective drug for SP cells.(Table1)
Conclusion
In our study, there was lack of evidence that SP cells was consistent with MM stem cells. No difference was observed for any other marker between SP cells and MP cells. However SP cells had higher proliferation index and clonogenicity compared with MP cells. We suggest that SP cells are rather related to resistance of drugs. Furthermore, bortezomib reduced the SP cells more effectively compared to other drugs.
No relevant conflicts of interest to declare.
Author notes
Asterisk with author names denotes non-ASH members.


This feature is available to Subscribers Only
Sign In or Create an Account Close Modal