Abstract
Background
Immunoglobulin light chain amyloidosis (AL amyloidosis) is a plasma cell dyscrasia characterized by deposition of amyloid fibrils in various organs and tissues, derived from monoclonal immunoglobulin light chains (LC), leading to organ dysfunction. Until now there is no systematic study of genomic expression of patients with AL amyloidosis compared to other monoclonal gammopathies.
Aim of this study was to reveal genomic expression differences between AL amyloidosis patients versus healthy donors (ND), monoclonal gammopathy of undetermined significance (MGUS), smouldering myeloma (SMM) and multiple myeloma (MM) patients.
Methods
Gene expression profiling data from GEO database (GSE6477, GSE24128) comprised of ND (n=15), MGUS (n=21), SMM (n=24), MM (n=69) and AL (n=16) patients were used. To ensure the comparability between arrays and eliminate the batch effect, quantile normalization was performed. To identify the AL patients´ gene expression profile which significantly differs in comparison with ND, MGUS, SMM or MM patients, we applied SAM algorithm for 6588 selected genes that fulfilled the condition having standard deviation above the median. Genes with fold change ≥1.5 or ≤0.5 and false discovery rate >0.001 were considered as significant. Prediction analysis of microarrays (PAM) using nearest shrunken centroids and cross validation assay was carried out to identify the smallest subsets of genes that were able to accurately predict classes.
Results
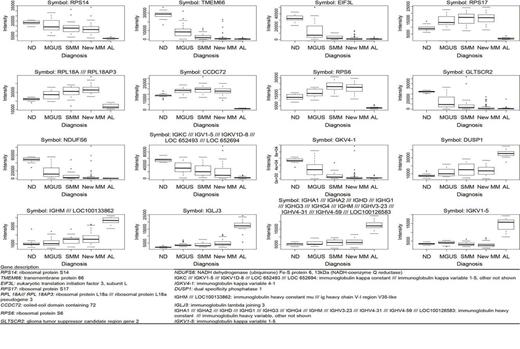
Comparison of AL patients vs. ND revealed 229 changed genes, AL vs. MGUS 126 genes, AL vs. SMM 338 genes and AL vs. MM 110 genes, respectively. Out of them, the most significantly changed 100 genes from each comparison were further analysed. Some of the genes occurred repeatedly, thus only 256 of genes from all comparisons were unique. Using PAM algorithm we found the genes that have the best predictive power for differentiation AL patients from ND, MGUS, SMM and from MM patients was as followed: RPS6, RPS14, RPS17, RPLA18A, TMEM66, EIF3L, CCDC72, GLTSCR2, NDUFS6, DUSP1, IGLJ3, IGHM, IGKV1-5IGKC///IGKV1-5///IGKV1D-8 and IGHA1///IGHA2///IGHD///IGHG1///IGHG3///IGHG4///IGHM/// IGHV3-23///IGHV4-31///IGHV4-59. Gene expression changes are presented on Figure 1.
Conclusion
Based on offered meta-analysis, 16 genes representing mostly ribosomal proteins and immunoglobulin regions allow us to detect specific aberrant clone responsible for pre-amyloid production and can serve as candidates for further detailed study.
Work was supported by grants IGA NT 12130, NT 14575 and NT 13190.
Gene expression for the genes which best discriminate AL patients from ND, MGUS, SMM and MM patients
Gene expression for the genes which best discriminate AL patients from ND, MGUS, SMM and MM patients
Hajek:Merck: Consultancy, Honoraria; Celgene: Consultancy, Honoraria; Janssen: Honoraria.
Author notes
Asterisk with author names denotes non-ASH members.


This feature is available to Subscribers Only
Sign In or Create an Account Close Modal