Abstract
BACKGROUND.
Chronic Myeloid Leukemia (CML) is a myeloproliferative neoplasm characterized by an aberrant protein (BCR–ABL) which is a constitutively active tyrosine kinase. According to the latest ELN recommendations for the management of CML, molecular response (MR) is best assessed according to the International Scale (IS) as the ratio of BCR-ABL1 transcripts to ABL1 transcripts, or other internationally recognized control transcripts. It is expressed and reported as BCR-ABL1% on a log scale where 10%, 1%, 0.1%, 0.01%, 0.0032%, and 0.001% correspond to a decrease of respectively 1 (MR1), 2 (MR2), 3 (MR3), 4 (MR4), 4.5 (MR4.5) logs below the standard baseline that was used in the IRIS study.
Recent advances in the proteomic field have allowed us to better understand the biology of several cancer types and/or discover new candidate biomarkers, but very few data are available in CML.
AIMS.
The purpose of this study was to evaluate a possible correlation between depth of MR and proteomic profile in sera samples obtained from the peripheral blood and bone marrow of CML patients.
PATIENTS AND METHODS
Samples were consecutively and prospectively obtained from 20 CML patients observed between January and June 2014 at the Hematology Unit of the National Cancer Research Centre “Istituto Tumori Giovanni Paolo II” in Bari, Italy. Each individual involved in the study signed an informed consent form authorizing the Institute to utilize their biological tissues for research purposes. All patients at diagnosis displayed the classic t(9;22) Ph chromosome according to standard cytogenetics. The BCR/ABL transcript at RT-PCR was b3a2 in 13 patients and b2a2 in 7 patients.
Peripheral blood and bone marrow samples were centrifuged within 30 minutes of sample taking. Serum specimens were immediately collected and frozen at −80°C.
Twenty sera from peripheral blood were sampled from 5 patients in MR1 response, four in MR2, eight in MR3, two in MR4 and 1 patient at diagnosis; for eleven patients serum from bone marrow was also available; in particular 2 were sampled from patients in MR1, 3 in MR2, 4 in MR3, 1 in MR4 and 1 at diagnosis.
Patients were grouped in two cohorts: the first comprised those with lower molecular response to MR3 (group A: 10 patients) and the second greater than or equal to MR3 (group B: 10 patients).
The association of proteomic profile with molecular response was performed using the SELDI ToF Mass Spectrometry platform. Each specimen was spotted on an IMAC30 metal affinity protein-chip, prepared according to the manufacturer's instructions, and analyzed in duplicate.
RESULTS
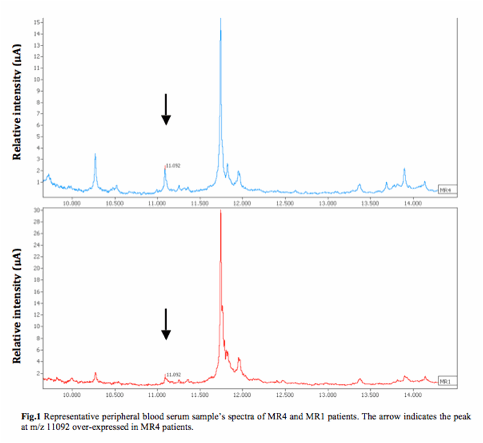
Fourteen differentially expressed peaks were highlighted when comparing peripheral sera from group A and group B, but none was statistically significant. When comparing 11 available serum samples from the bone marrow of groups A (6) and B (5), four peaks (m/z 10629, m/z 3889, m/z 7772, m/z 7987) were reported as differentially expressed in a statistically significant way (p<0.05). Focusing the differential expression analysis in peripheral sera only on MR1 patients (including one patient at diagnosis) versus MR4 patients, one peak at m/z 11092 was identified as significantly and differentially expressed (p < 0.05) (Figure 1). Similarly, comparing bone marrow sera only from MR1 and MR4 patients respectively, 32 peaks were differentially expressed. Once again the peak at m/z 11092 resulted under expressed in MR1 patients, and interestingly the single patient at diagnosis had the lowest value. No statistical differences were evidenced when comparing peripheral blood and bone marrow sera obtained from b3a2 and b2a2 patients.
CONCLUSIONS
These preliminary data suggest that an over-expression of m/z 11092 in serum obtained from peripheral blood and bone marrow could be associated with a deeper molecular response; further investigations are needed on a larger number of patients in order to confirm or refute our results and, to definitively characterize the peak at m/z 11092.
No relevant conflicts of interest to declare.
Author notes
Asterisk with author names denotes non-ASH members.


This feature is available to Subscribers Only
Sign In or Create an Account Close Modal