Abstract
Background
Febrile neutropenia (FN) is a common occurrence associated with chemotherapy regimens used in patients (pts) with acute myelogenous leukemia (AML). Febrile neutropenia is presently defined as a single temperature of ≥38.3°C (101°F) or a temperature of ≥38.0°C (100.4°F) for >1 hour in a patient with an absolute neutrophil count < 500/mm3. Due to the potential for life threatening infections, fever in a patient with neutropenia is considered an oncologic emergency. Initiating appropriate antibiotic therapy as soon as possible in these patients leads to better outcomes. However, to our knowledge, there is no evidence that supports the current definition of neutropenic fever.
Aim
To identify a temperature pattern that is predictive of the subsequent development of febrile neutropenia in neutropenic pts with AML
Methods
After obtaining IRB approval we retrospectively obtained demographic and temperature data from hospitalized patients with AML undergoing induction therapy who were admitted to our institution between 12/8/2012 and 12/7/2013. Temperature data was recorded at intervals per physician order and nursing discretion during admission. We identified fever as a single temperature ≥38.3°C (101°F) or consecutive temperatures recorded 1 hour apart ≥38.06°C (100.5°F).
Data was processed using SAS data programming to create and summarize this pilot temperature series data. Data for 68 patients containing 137 fever events was divided into 203 segments: a series was considered to end at the time of fever (or end of data) and a new series for the same patient began 24 hours after a preceding fever. Plots were created showing temperature over time leading up to fever (end of series).
Our data consists of unequal interval time series data and does not lend itself to the usual methods of statistical ROC analysis. An ROC-like analysis to estimate sensitivity and specificity of a maximum temperature that predicts for a subsequent episode of FN was performed. Temperature data was subset into 7 time intervals: a pre-fever interval spanning 4 to 28 hours preceding fever or series end, and 6 non-fever intervals, each 24 hours long and spanning the period from 48 to 192 hours before fever or series end, for a total of 854 data windows. Statistics on each patient series within each interval were used as variables in predicting fever onset in logistic regression analysis. The variables included were maximum temperature within 24 hours, minimum temperature within 24 hours, average of positive increases between subsequent measurements, and largest 24 hour increase.
Statistical analysis consisted of a generalized linear model with logit link (logistic regression) predicting fever at least 4 hours before onset, and used generalized estimating equations to adjust for correlated temperature measures within patient.
Results
Of the 68 patients identified, 47% were male, 53% were female with a mean age of 56.3 ± 15.1 years.
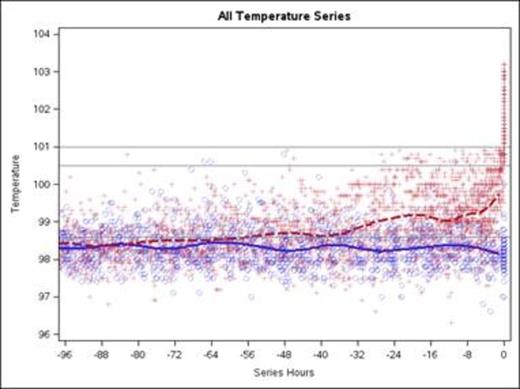
Our fever curve plots suggest that there is an increase in average temperature at least 24 hours before the onset of fever in those patients that will go on to develop a fever by current definition (Figure 1).
A prediction score including, maximum temperature within 24 hours, minimum temperature within 24 hours, average of positive increases between subsequent measurements, and largest 24 hour increase was able to predict 86.1% of oncoming FN events 4 to 28 hours before onset and reject 67.4% of non-FN events. This rule has a negative predictive value of 96.2% and a positive predictive value of 33.7%.
Discussion
Our analysis demonstrates the feasibility of using temperature series data for early prediction of FN. A more comprehensive analysis is planned and is expected to result in higher sensitivities. If subsequent analysis proves to be significant this data may be used to develop future prospective clinical studies to evaluate new fever criteria and may alter our current definition and management of pts with FN.
4-days of temperature series data preceding onset of fever or end of series if no fever. The dark lines are LOESS smoothed average temperatures for series ending in fever (dash) or non-fever (solid).
4-days of temperature series data preceding onset of fever or end of series if no fever. The dark lines are LOESS smoothed average temperatures for series ending in fever (dash) or non-fever (solid).
No relevant conflicts of interest to declare.
Author notes
Asterisk with author names denotes non-ASH members.


This feature is available to Subscribers Only
Sign In or Create an Account Close Modal