Abstract
Background: Multiple myeloma (MM) is an incurable B-cell malignancy resulting in significant morbidity and mortality, the incidence of second place in hematological malignancies. The proteasome inhibitor bortezomib inhibits IkappaB degradation, prevents NF-kappaB activation, and induces apoptosis in MM cells, has become first-line drug to MM. Despite its promising activity in traditional chemoresistant myeloma patients, however, some patients are resistant or become refractory to bortezomib. Chauhan D et al reported that Blockade of Hsp27 overcomes bortezomib resistance in lymphoma cells (Chauhan D et al., Cancer Re, 2003). However, bortezomib resistance mechanisms in MM remain controversial, the molecular basis of this reduced responsiveness is currently not fully understood.
Objective: To establish a bortezomib-resistant cell line KM3 /BTZ of MM, then search for genes related to bortezomib resistance phenotype by analyzing the differential gene expression patterns with cDNA microarray,and explain the mechanism of bortezomib-resistant multiple myeloma.
Methods: Bortezomib-resistant KM3/BTZ cell line was generated by increasing concentration of bortezomib to induce KM3 cells in vitro. MTT assay was employed to detect the cytotoxic effect on KM3 and KM3/BTZ cells. The cells apoptosis were analyzed by flow cytometry. We detect the gene expression profile changes between KM3/BTZ and its parent cell line KM3 cells by CDNA microarray. Combining of molecular annotation system MAS3.0 software and detailed analysis of documented resistance genes were used to analyze the data. Specific differentially-expressed genes were chosen for further verification using real-time RT-PCR. The expression of multi-drug resistance 1(MDR-1) gene mRNA was determined by RT-PCR.
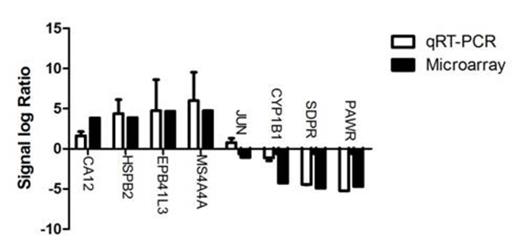
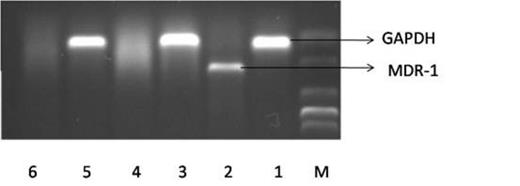
Results: The KM3/BTZ cell line was established successfully. Bortezomib resistance index values were significantly higher in KM3/BTZ (IC50 =351.2±3.51ng /ml) when compared to KM3 cells (IC50 = 17.8±1.03ng /ml),and the resistance index is 19.7 (P< 0.05). Through gene expression profiling filtering, compared with KM3,770 significantly differently expressed genes were screened out in the KM3/BTZ cell line, of which up and down regulated genes were 287 and 383 respectively, in which heat shock protein family gene HSPB2 was significantly up-regulated (Ratio=14.7455). Downregulated gene list in KM3/BTZ cell line included transcriptional regulators like ZNF family proteins (Tab 1). Upregulated genes in KM3/BTZ cell line included signal transduction related genes like MS4A family protein (Tab 1) also transcriptional regulators like ZNF family proteins (Tab 1). The expression trend of eight genes for further verification was almost consistent with the microarray, excepting gene of JUN (Fig 1). The expression of MDR-1 mRNA was not observed in either resistant or parental cells (Fig 2).
Conclusion: We have successfully established bortezomib-resistant cell line KM3/BTZ. MDR-1 was not involved in bortezomib-resistant multiple myeloma cells.HSPB2, ZNF and MS4A family genes are probably related to bortezomib resistance in KM3/BTZ cells. Our results suggest that they may be new targets to overcome resistance to bortezomib in patients with MM.
ZNF and MS4A family gene expression in KM3/BTZ and KM3 cells
| Gene . | B signal* . | B detection* . | A signal* . | A detection* . | BvsA signal log ratio* . | BvsA change* . |
|---|---|---|---|---|---|---|
| ZNF711 | 85.08 | P | 206.16 | P | 0.41269 | D |
| ZNF92 | 6.75 | P | 14.57 | P | 0.46328 | D |
| ZNF704 | 10.7 | A | 26.78 | P | 0.39955 | D |
| ZNF492 | 7.08 | P | 3.48 | P | 2.03448 | I |
| ZNF532 | 87.93 | P | 43.54 | A | 2.01952 | I |
| ZNF594 | 10.25 | P | 4.63 | P | 2.21382 | I |
| ZNF789 | 269.79 | P | 97.3 | P | 2.77276 | I |
| ZNF506 | 330.36 | P | 149.48 | P | 2.21006 | I |
| MS4A3 | 1721.58 | P | 145.3 | P | 11.84845 | I |
| MS4A4A | 2688.23 | P | 100.8 | P | 26.66895 | I |
| MS4A6A | 141.96 | P | 56.47 | M | 2.513901 | I |
| MS4A1 | 49.02 | P | 53.11 | P | 0.92299 | NC |
P: High expression; A: Low expression; M:Marginally D: Decrease; I: Increase; NC: No change
*: A:KM3; B: KM3/BTZ
M: DNA Marker; 1-2: K562/A cell line; 3-4: KM3cell line; 5-6: KM3/BTZ cell line
No relevant conflicts of interest to declare.
Author notes
Asterisk with author names denotes non-ASH members.


This feature is available to Subscribers Only
Sign In or Create an Account Close Modal