Abstract
We performed a transcriptome-wide analysis of bone marrow (BM) CD19+ cells of WM vs. IgM-MGUS to find the genes and key pathways mostly involved in the comparison between WM and IgM-MGUS.
We isolated BM CD19+ and CD138+ cells of 36 WM and 13 IgM-MGUS using Miltenyi Microbeads and we performed expression analysis with Affymetrix GeneChip HG U133 Plus 2.0 Array.
Data was processed using RMA and analyzed using SAM and a false discovery rate threshold of 5% to select the differentially expressed genes. To further select a subset of robust biomarkers, SVMs were used in a Monte Carlo bootstrap resampling schema with B=100 external training/test splits to discriminate between WM and IgM-MGUS.
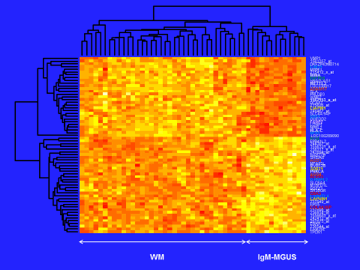
641 probes were selected by SAM on CD19+ cells. SVMs permitted the selection of 66 robust biomarker genes (Fig.1) with a MCC accuracy on external samples equal to 0.87. Functional enrichment analysis demonstrated the involvement of the following pathways:
- Notch signaling pathway: ADAM17 (promoting cell growth) was upregulated while AGO1 and AGO4 (negative regulation of translation) were downregulated in WM
- CAPRIN1 and SORT1 (pro-apoptosis) were underexpressed while CIAPIN1 (anti-apoptosis) was overexpressed in WM
- Purine/pyrimidine metabolism (cell growth): ENTPD5 (cell proliferation) was overexpressed while NT5E (catabolic process) was underexpressed in WM
- Sphingolipid pathway: ACER3, COL4A3BP, GBA3 were downregulated in WM
- Rho-protein signal transduction: FARP2 (cell survival) was overexpressed in WM
- Transcription: ITPRIPL2, L3MBTL4 were underexpressed while NFX1, LIMS1 (cell aging) USF1 were overexpressed in WM
- Immune system: HLA-C was upregulated in WM
- PRKCA was underexpressed in WM and involved in 85 pathways (MAPK-NGF-EGF-VEGF-ErbB-Ras-HIF-1-mTOR-PI3K-Akt)
- MIR1204///PVT1 (oncogene), METTL3 (RNA-methylation), MINA (cell survival) were upregulated in WM
As a second step of the study, we investigated 7 IgM-MGUS and 11 WM (2 symptomatic and 9 asymptomatic) newly diagnosed patients.
We isolated the BM B cell clones (CD45+,CD38+,CD19+,LAIR-1-; CD27dim, IgM+, CD22dim, CD25+) using cell sorting with MoFlo XDP 3 laser cell sorter (Beckman Coulter). We identified clonally restricted B lymphocyte populations using BD LSRFortessa Flow Cytometer equipped with 5 lasers.
We performed gene expression profiling (GEP) of the isolated BM cell clones of WM vs. IgM-MGUS using Affymetrix next-generation GeneChip HTA 2.0 to further investigate genomic complexity.
The data was preprocessed and normalized using RMA. Selection and data analysis were performed using the t-test as implemented in the Affymetrix Transcriptome Analysis Console.
Functional enrichment analysis performed using DAVID, demonstrated that groups of genes belonging to relevant functional categories were deregulated in the comparison between WM vs. IgMMGUS:
- CSH2, GH2, NTF3, NPY genes which belonged to the PI3K/Akt, JAK-STAT, MAPK pathways
- CSHL1 regulating cell growth
- CLDN19 involved in the cell adhesion
- EIF2AK3, EIF2B4 were involved in the GSK3 signaling (cellular proliferation, migration, inflammation, immune responses, glucose regulation and apoptosis)
- NPPA belonging to the HIF-1 signaling pathway
In conclusion, GEP of BM CD19+ cells demonstrated that 66 genes were robust biomarkers able to distinguish between WM and IgM-MGUS. The negative regulation of translation, pro-/anti-apoptotic processes, Notch signaling pathway, Purine/Pyrimidine metabolism, Sphingolipid metabolism and the regulation of transcription were mostly involved in the comparison between WM and IgM-MGUS.
On the other hand, microarray of BM B cell clones (CD45+,CD38+,CD19+,LAIR-1-; CD27dim, IgM+, CD22dim, CD25+) identified groups of genes and pathways deregulated in the comparison between WM and IgM-MGUS. No statistically significant differences of expression were identified between WM vs. IgM-MGUS after correction for multiple testing. Moreover, fold-changes of transcripts whose p-value was lower than a nominal significance level of 5% were higher than 2 (absolute value) in only 4 out of 217 cases.
We could suppose that the isolated clonal B-cell populations of WM and IgM-MGUS identified by flow citometry present similar expression signatures. Ongoing experiments of GEP of BM B cell clones vs. BM CD19 depleted cells of WM as well as IgM-MGUS could clarify the gene expression profiles of WM and IgM-MGUS.
No relevant conflicts of interest to declare.
Author notes
Asterisk with author names denotes non-ASH members.


This feature is available to Subscribers Only
Sign In or Create an Account Close Modal