Abstract
Introduction Mantle-cell lymphoma (MCL) is a rare B-cell malignancy associated with high rates of relapse and poor survival. Aggressive treatment strategies, including dose-intensified chemotherapy and hematopoietic stem cell transplantation, are commonly utilized in an attempt to improve outcomes in this disease. The MCL international prognostic index (MIPI) is a validated tool for estimating survival risk; however, the role of risk-adapted therapy in MCL has not been defined. To better understand the role of treatment intensity in patients with lower risk MCL, we conducted a retrospective analysis of survival outcomes by treatment intensity in patients with low or intermediate risk MIPI scores.
Purpose To assess the impact of treatment intensity on survival outcomes in newly diagnosed patients with lower risk MCL.
Methods Patients with MCL and low or intermediate risk MIPI scores diagnosed between 1992 and 2012 were identified through our institutional databases. Clinical variables were collected and MIPI scores were calculated for each patient. Frontline treatment modalities were categorized into 4 groups: watchful waiting, low intensity (splenectomy, radiation, or rituximab monotherapy), moderate intensity (CHOP, bendamustine, lenalidomide, or equivalent), and high intensity therapy (at least 4 cycles of HyperCVAD or equivalent and/or stem cell transplant). Median progression free survival (PFS) and overall survival (OS) for each treatment group were estimated using the Kaplan-Meier (KM) method and compared using the log rank test. Cox regression was used to identify univariate predictors of survival.
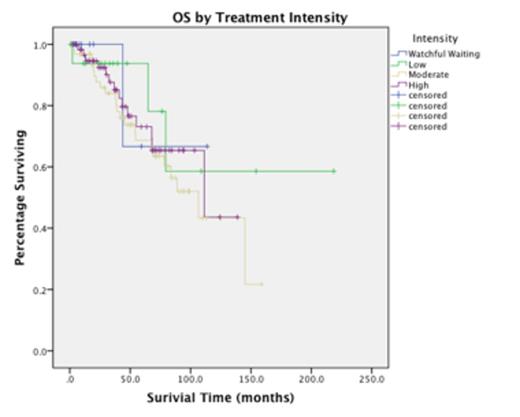
Results A total of 154 patients with low or intermediate risk MCL were identified. Watchful waiting, low, moderate, and high intensity treatment accounted for 8.4%, 11.7%, 40.9%, and 39.0% of patients, respectively. Intensively treated patients were more likely to be young, male, and have a higher B2-microglobulin (Table 1). With a median follow-up of 52 months, the median PFS was 31.48 mo (95% CI, 24.03-38.93) and the median OS was 111.35 mo (95% CI, 70.28-154.42). There was no statistically significant difference in OS by treatment strategy (p=0.665)(Figure 1). This lack of survival difference was true for all pairwise log-rank comparisons between treatment groups. There was a significant improvement in PFS for high intensity versus moderate intensity chemotherapy (median PFS 55.92 mo versus 18.55 mo, p<0.001)(Figure 2). However, this benefit was limited to those less than or equal to 65 years of age (p<.001), and did not extend to those treated with moderate intensity when followed by maintenance rituximab (N=16, p=0.259). As reported by others, the presence of B symptoms (HR 2.23, p=0.011), female gender (HR 2.98, p=0.024), and the B2-microglobulin at diagnosis (HR 2.50, p=0.043) were all significantly correlated with OS. No significant correlation with OS was observed with age (p=0.688), stage (p=0.366), MIPI risk (p=0.141), or treatment intensity (p=0.676).
Conclusions Prior studies have speculated that frontline intensive treatment approaches may improve OS in MCL, with a more pronounced impact among low and intermediate risk patients. In this retrospective analysis, we were not able to validate this hypothesis, with pronounced median OS approximating 10 years in spite of variations in treatment intensity. Median PFS was significantly longer in those patients treated with high intensity therapy, but this improvement was limited to those patients who were less than 65 years of age and was no longer significant when the addition of maintenance rituximab was accounted for. These data highlight the lack of a "standard of care" in MCL, and provide further rationale for the use of novel agents and maintenance approaches in those with newly diagnosed MCL.
| Characteristics, N(%) . | Watchful Waiting N=13 . | Low Intensity N=18 . | Moderate Intensity N=63 . | High Intensity N=60 . | p-value . |
|---|---|---|---|---|---|
| Age, median (range) | 65 (40-75) | 64.5 (42-78) | 64 (40-80) | 58.5 (40-71) | 0.004 |
| Male | 8 (61.5) | 10 (55.6) | 51 (81.0) | 49 (81.7) | 0.054 |
| Stage III-IV | 11(100) | 11 (61.1) | 59 (93.7) | 54 (90.0) | 0.001 |
| B2-microglobulin (%ULN), median (range) | 80 (64-95) | 74 (64-491) | 127 (83-327) | 126 (63-255) | 0.607 |
| LDH (%ULN), median (range) | 73 (57-100) | 69 (50-152) | 79 (42-310) | 86 (42-163) | 0.115 |
| MIPI Risk | |||||
| Low | 4 (30.8) | 10 (55.6) | 30 (47.6) | 35 (58.3) | 0.287 |
| Intermediate | 9 (69.2) | 8 (44.4) | 33 (52.4) | 25 (41.7) |
Shah:Janssen: Speakers Bureau; Pharmacyclics: Speakers Bureau; Celgene: Consultancy, Speakers Bureau.
Author notes
Asterisk with author names denotes non-ASH members.


This feature is available to Subscribers Only
Sign In or Create an Account Close Modal