Abstract
Background: t-MDS/AML is the leading cause of non-relapse mortality after aHCT for NHL. Older age at aHCT, exposure to total body irradiation (TBI), and low number of CD34+ cells infused are associated with an increased risk of developing t-MDS/AML. However, over the past decade, aHCT has been increasingly used for older patient populations (potential for increase in t-MDS/AML risk). On the other hand, use of TBI has declined and number of CD34+ cells infused has increased (potential for decrease in t-MDS/AML risk). The impact of these changes in aHCT clinical practice on t-MDS/AML risk has not been assessed, and is addressed here.
Methods: Information regarding t-MDS/AML diagnosis was procured from medical records and California Cancer Registry to ensure near-complete capture of events. Competing risk analysis was used to describe the cumulative incidence of t-MDS/AML, and to evaluate the role of host and aHCT-related factors in the development of t-MDS/AML. In order to understand the impact of changing clinical practices, patients were classified into those transplanted in the early era (1986-2002) vs. recent era (2003-2009).
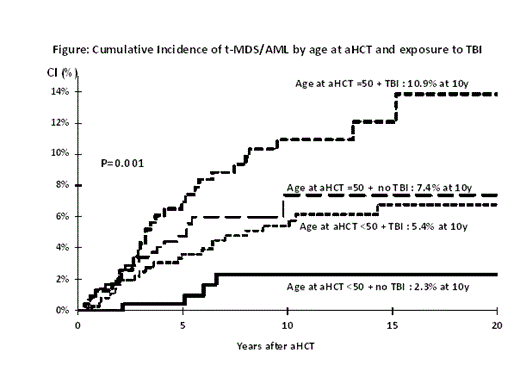
Results: A total of 1,261 consecutive patients received aHCT for NHL between 1986 and 2009 at City of Hope, and were followed for development of t-MDS/AML until 12/31/2011. Median age at aHCT was 50y (range, 5-78). Compared with patients transplanted in early era, those transplanted in recent era were more likely to be ≥50y at aHCT (recent era: 65% vs early era: 44%, p<0.001); less likely to be conditioned with TBI (recent era: 17% vs. early era: 67%, p<0.001); but more likely to receive a larger CD34+ cell dose (>3x10(6)/Kg: recent era 18% vs. early era: 12%, p<0.0001). After a median follow-up of 4.8y (range, 0.02-24.6),78 patients developed t-MDS/AML, yielding a 15y cumulative incidence of 7.5%. The cumulative incidence of t-MDS/AML was higher among those ≥50y (10.0% vs. 5.3%, p=0.002), and among those exposed to TBI (8.8% vs. 5.2%, p=0.07). Taken together, older patients exposed to TBI had a significantly higher cumulative incidence of t-MDS/AML (10.9%), as compared with younger patients not exposed to TBI (2.3%, p<0.001, Figure). Furthermore, the cumulative incidence of t-MDS/AML was higher among those with a low CD34+ cell dose (<3x10(6)/Kg) (14.2%) vs. those with a high CD34+ cell dose (≥3x10(6)/Kg) infusion (4.3%, p<0.0001). Multivariable competing risk analysis (adjusted for era) demonstrated the independent and significant impact of older age (≥50y: HR=2.4, 95%CI, 1.5-3.9, p=0.0004 [ref grp: <50y]), exposure to TBI (HR=1.8, 95%CI, 1.1-3.1, p=0.02 [ref grp: no TBI]), and low CD34+ cell count (<3x10(6)/Kg, HR=3.3, 95%CI, 1.9-5.8, p<0.0001 [ref grp: ≥3x10(6)/Kg]) in increasing the risk of t-MDS/AML. The impact these findings in light of changing practices with time is detailed in Table and summarized here. Multivariable analysis (taking age at aHCT into account) demonstrated that the risk of t-MDS/AML was reduced by 50% among those transplanted in the recent era (HR=0.5, 95%CI, 0.3-0.9, p=0.03 [ref grp: early era]) (Model 1). However, inclusion of TBI and CD34+ cell count in the model abrogated the reduction in the risk of t-MDS/AML during the recent era (HR=0.97, 95%CI, 0.5-1.9, p=0.9, referent grp: early era) (Model 2).
Conclusions: This large study spanning over 25y confirms the independent role of age at aHCT, TBI, and CD34+ cell count in t-MDS/AML risk. More importantly, the study delineates the risk of t-MDS/AML in the context of changes in clinical practice of aHCT for NHL, demonstrating a reduction in the incidence of t-MDS/AML (despite an increase in age limit for aHCT) that is likely due to the declining practice of using TBI and the ability to use a higher number of CD34+ cells for aHCT.
| Model 1 . | Model 2 . | Model 3 . | |
|---|---|---|---|
| HR (95% CI), p-value . | HR (95% CI), p-value . | HR (95% CI), p-value . | |
| Era of aHCT | |||
| 1986-2002 | 1.0 | 1.0 | 1.0 |
| 2003-2009 | 0.54 (0.3-0.9), p=0.03 | 0.71 (0.4-1.3), p=0.3 | 0.97 (0.5-1.9) p=0.9 |
| Age at aHCT | |||
| <50y | 1.0 | 1.0 | 1.0 |
| ≥50y | 2.09 (1.3-3.4), p=0.002 | 2.25 (1.4-3.6), p=0.0007 | 2.41 (1.5-3.9) p=0.0004 |
| Conditioning with TBI | |||
| No TBI | 1.0 | 1.0 | |
| Yes TBI | 1.80 (1.1-3.0), p=0.02 | 1.8 (1.1-3.1) p=0.02 | |
| CD 34 counts | |||
| >3 | 1.0 | ||
| ≤3 | 3.32 (1.9-5.8) p<0.001 | ||
| missing | 2.36 (1.2-4.5) p=0.01 | ||
No relevant conflicts of interest to declare.
Author notes
Asterisk with author names denotes non-ASH members.


This feature is available to Subscribers Only
Sign In or Create an Account Close Modal