Abstract

Objectives: Up to one third of patients with acute myeloid leukemia (AML) and abnormal cytogenetics have persistent cytogenetic abnormalities (pCytAbnl) at morphologic complete remission (mCR). We hypothesized that the prognostic significance of pCytAbnl in patients undergoing allogeneic hematopoietic stem cell transplantation (allo-HSCT) in mCR varies with the cytogenetic risk group. Previous studies on the subject have been small, inconclusive, or inconsistent.
Methods: We analyzed the data from a large cohort of patients (n = 118) with AML and abnormal cytogenetics who underwent allo-HSCT in mCR, and developed a simple risk stratification model based on pCytAbnl and cytogenetic risk group to compare time to relapse (TTR), relapse-free survival (RFS), and overall survival (OS).
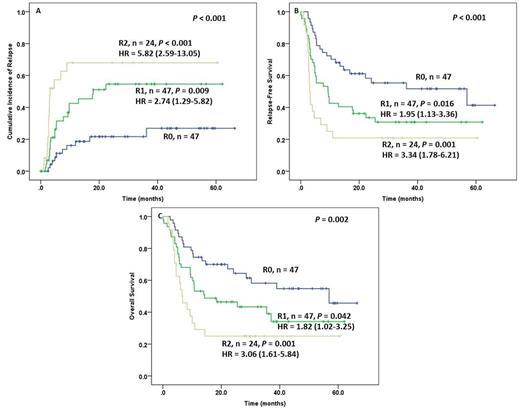
Results: The mean (standard deviation) age of patients was 51 (14) years, and 58% were male. AML was therapy-related in 21 (31%) patients. The most frequent FAB subtypes were M0/M1/M2 (46%), followed by M4/M5 (26%). Favorable, intermediate and unfavorable cytogenetic risk disease was present in 18%, 28%, and 54% of patients, respectively. The majority (73%) of patients were in CR1. Conditioning was myeloablative in 67% of patients and reduced-intensity in the remainder. The groups with or without pCytAbnl were similar in all baseline and transplant characteristics except age, CR number and cytogenetic risk group. Specifically, patients with pCytAbnl were significantly older (56 ± 12 vs. 48 ± 15 years; P = 0.004), were in first CR more frequently (86% vs. 67%; P = 0.042), and were more likely to have unfavorable risk cytogenetics (P = 0.027) than patients without pCytAbnl. Univariate analysis was performed using the following variables: age, gender, therapy-related AML (present vs. absent), pCytAbnl (present vs. absent), cytogenetic risk group (unfavorable vs. intermediate/favorable), CR number (≥2 vs. 1), conditioning regimen (myeloablative vs. reduced intensity), and donor type (matched unrelated vs. sibling). There was a significant association between outcome (OS, RFS, and TTR) and the following variables: pCytAbnl, cytogenetic risk group, and the conditioning regimen. Additionally, CR number was significantly associated with TTR. In multivariate regression analysis with these four variables (Table 1), only pCytAbnl, cytogenetic risk group, and the conditioning regimen had a significant impact on outcome. A risk scoring system was then built using pCytAbnl and cytogenetic risk group. The model distinguished 3 groups of patients with distinct outcomes (Figure 1). The group with pCytAbnl and unfavorable risk cytogenetics (R2, n = 24) had the shortest median TTR (3 months), RFS (3 months), and OS (7 months). The group with favorable/intermediate risk cytogenetics and without pCytAbnl (R0, n = 47) had the longest median TTR (not reached), RFS (57 months), and OS (57 months). The group with pCytAbnl and favorable/intermediate risk cytogenetics, or without pCytAbnl but with unfavorable risk cytogenetics (R1, n = 47) experienced intermediate TTR (18 months), RFS (9 months), and OS (14 months).
Conclusions: A composite cytogenetic risk model identifies patients with AML in mCR with distinct relapse, RFS, and OS rates following allo-HSCT.
Multivariate analysis for survival outcomes using variables with a significant association in univariate analysis
| OS | RFS | TTR | ||||
| HR (95% CI) | P | HR (95% CI) | P | HR (95% CI) | P | |
| pCytAbnl + vs. - | 0.54 (0.32-0.91) | 0.020 | 0.53 (0.32-0.86) | 0.010 | 0.44 (0.24-0.80) | 0.007 |
| Cytogenetic risk U vs. F/I | 0.60 (0.36-0.99) | 0.047 | 0.55 (0.34-0.98) | 0.014 | 0.45 (0.23-0.95) | 0.023 |
| CR number ≥2 vs. 1 | - | - | - | - | 1.51 (0.58-3.95) | 0.404 |
| Conditioning MA vs. RI | 1.71 (1.04-2.81) | 0.035 | 2.04 (1.27-3.27) | 0.003 | 2.85 (1.57-5.15) | 0.001 |
CI: confidence interval; F/I: Favorable/Intermediate; HR: hazard ratio; MA: myeloablative; RI: reduced intensity; U: unfavorable
Cumulative risk of relapse (A), relapse free survival (B) and overall survival (C) based on persistent cytogenetic abnormalities and cytogenetics. R0, R1, and R2 are defined in the text.
Cumulative risk of relapse (A), relapse free survival (B) and overall survival (C) based on persistent cytogenetic abnormalities and cytogenetics. R0, R1, and R2 are defined in the text.
No relevant conflicts of interest to declare.
Author notes
Asterisk with author names denotes non-ASH members.

This icon denotes a clinically relevant abstract


This feature is available to Subscribers Only
Sign In or Create an Account Close Modal