Abstract
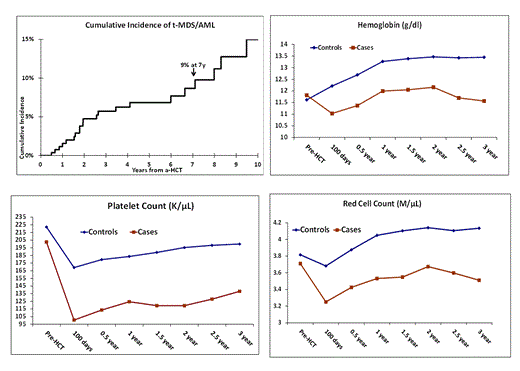
t-MDS/AML is the most common cause of non-relapse mortality in patients undergoing autologous hematopoietic cell transplantation (aHCT) for Hodgkin lymphoma (HL) or non-Hodgkin lymphoma (NHL). Cytopenias are a common occurrence in the early post-aHCT period. To better understand the significance of cytopenias with respect to the risk of t-MDS/AML, we conducted a prospective, longitudinal study in patients undergoing aHCT for HL or NHL between 1999 and 2009 at City of Hope, with serial collection of peripheral blood samples from pre-aHCT to 10y. Patients with post-aHCT persistent disease (n=55) or solid second malignancies (n=9) or refusal to participate (n=18) were excluded from the analysis, leaving 292 study participants (HL: n=81; NHL: n=211). The median length of follow-up was 4.5y from aHCT. The cumulative incidence of t-MDS/AML approached 9% at 7y (Figure). Older age at aHCT (50+y: RR=3.6, 95%CI, 1.3-9.8, p=0.01) and exposure to total body irradiation (TBI: RR=2.5, 95%CI, 1.0-5.9, p=0.04) were associated with an increased risk of t-MDS/AML. Serial evaluation of peripheral blood parameters (hematocrit [Hct], mean corpuscular volume [MCV], red blood cell [RBC] count, hemoglobin [Hgb], red cell distribution width [RDW], white blood cell [WBC] count, and platelet [Plt] count) were abstracted from medical records at pre-aHCT, and after aHCT at d100, 6m, 1y, and annually thereafter for up to 10y (a total of 1,919 time points). This report focuses on alterations in peripheral blood parameters from pre-aHCT to several years post-aHCT among patients who developed t-MDS/AML (n=21; cases) and those who did not (n=271; controls). Values of peripheral blood parameters associated with post-aHCT relapse or development of t-MDS/AML were censored at 3m prior to the development of these events. As shown in the Figure, comparison of the peripheral blood parameters between cases and controls revealed that Hct, Hgb, Plt, and RBC values were significantly lower for cases compared to controls at d100, 6m, 1y, and 2y (p<0.001); WBC values for cases were lower than for controls at the pre-aHCT, d100, and 6m time points (p<0.01); RDW and MCV values did not differ between cases and controls. A Cox regression model was fitted to the data to examine the association between t-MDS/AML and specific low peripheral blood parameter values at d100, 6m, and 1y post-aHCT (adjusting for year of aHCT, age at aHCT, primary diagnosis, race/ethnicity, sex and TBI). The following parameters (with their cutpoints) emerged as significantly associated with increased risk of t-MDS/AML: Hgb<12, Plt<100k, and RBC<3. Compared with patients with Hgb, Plt and RBC values above these cutpoints at d100, 6m, or 1y, those with low values for all three blood parameters had a significantly increased risk of developing t-MDS/AML (d100: HR=10.5, 95%CI, 2.1-53.1, p=0.004; 6m: HR=9.9, 95%CI, 1.9-53.1, p=0.007; 1y: HR=10.7, 95%CI, 1.5-74.0, p=0.02). In summary, we consistently observed lower values for specific blood parameters during the post-aHCT period among patients who subsequently developed t-MDS/AML as compared to controls across multiple timepoints post-aHCT. These differences appeared soon after aHCT, persisted, and preceded the development of t-MDS/AML, providing evidence that bone marrow injury long predates the development of t-MDS/AML. Importantly, the combination of low Hgb, Plt, and RBC values at d100, 6m, or 1y predicted future development of t-MDS/AML, and could be used as early indicators of t-MDS/AML risk and the need for close monitoring.
| Peripheral blood parameters | Day 100 (HR, 95%CI) | p-value | 6 month (HR, 95%CI) | p-value | 1 year (HR, 95%CI) | p-value |
| All normal Hgb≥12 and Plt ≥100 and RBC ≥3 | 1.00 | 0.004 | 1.00 | 0.007 | 1.00 | 0.02 |
| All low Hgb <12 and Plt<100 and RBC <3 | 10.5 (2.1-53.1) | 9.9 (1.9-53.1) | 10.7 (1.5-74.0) |
No relevant conflicts of interest to declare.
Author notes
Asterisk with author names denotes non-ASH members.


This feature is available to Subscribers Only
Sign In or Create an Account Close Modal