Abstract
Background: Outcome studies for the unique cohort of young patients with multiple myeloma (MM) are sparse. In general, MM is a heterogenous disease with the genetic signature being one of the major determinants of prognosis. We have recently reported on improvement in overall survival (OS) of young patients with the use of novel agents, but the maximal survival gain has been achieved by integrating autologous stem cell transplant (SCT) to our current approach. Herein, we report on outcomes of patients with MM who were 50 years or younger at diagnosis and stratified by fluorescence in situ hybridization (FISH) results. Our study focuses on t(11;14) myeloma as its prognostic impact remains unclear with the use of novel agents upfront.
Methods: Out of 1384 patients with MM, evaluated consecutively at Mayo Clinic, Rochester, MN between 1/1/2000 and 12/31/2011, 290 (21%) were 50 years or younger at diagnosis. Interphase FISH, performed within 100 days of diagnosis of MM, was utilized to stratify patients as high-risk [deletion 17p, t(14;16), t(14;20) or t(4;14)] or standard-risk [normal FISH, trisomies, t(11;14), t(6;14) or monosomy13/deletion 13q]. FISH results were available in 125 young patients that comprise the cohort of interest in the current study. OS from diagnosis was estimated by the Kaplan-Meier method.
Results: Median age at diagnosis of MM was 47 years (range: 22 to 50 years) and 58% of the patients were male. At the time of data cut-off (7/31/2014), 45 (36%) patients had died with 90% of all known causes of deaths (n=39) being MM related. FISH abnormalities were noted in 114 (91%) patients. At diagnosis, 46%, 30% and 24% patients were categorized as International Staging System (ISS) stage I, II and III, respectively.
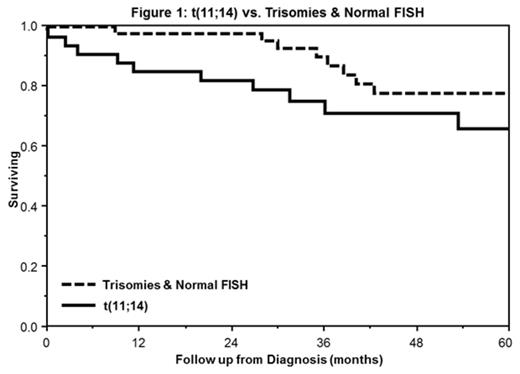
The estimated median follow up was 60 months (95% CI: 54-67) and the 5-year OS rate was 69% [median 86 months (95% CI: 76-108)]. Standard (n=100; 80%) and high (n=25; 20%) risk patients had a median OS of 89 months (95% CI: 76-108) and 77.6 months (95% CI: 42-130), respectively (p=0.87). In order to further investigate the similar outcomes between these broad risk-groups with typically diverse disease course, we assessed the outcomes based on the common genetic abnormalities (Table 1) within each of the 2 categories. Presence of t(11;14) (n=37; 29%) was associated with a significantly shorter median OS (76 months) compared to patients with trisomic and normal FISH profile (n=46) (91 months, p=0.01; Figure 1). Patients with t(11;14) also had a significantly shorter median OS compared to those with other standard-risk FISH abnormalities (median OS 96 months, p=0.02). Presence of t(11;14) was not associated with higher plasma cell labeling index (PCLI, p=0.29) or worse ISS stage (p=0.99) compared to patients without t(11;14). OS survival of patients with t(11;14) was similar to those with high risk features (median 76.2 vs. 77.6 months, p=0.32).
Of 24 (65%) patients with t(11;14) who underwent SCT, 79% had early SCT (within 12 months from diagnosis). Median OS was 79.4 months (95% CI: 36-108) vs. not reached (NR) (95% CI: 27-NR), respectively (p=0.79) in early versus late SCT. Twenty-one (57%) and 13 (35%) patients with t(11;14) received initial immunomodulatory drugs or bortezomib-based therapies, respectively. Those receiving frontline bortezomib had a higher median OS (76.2 months, 95% CI 76-79) compared to 64.8 months (95% CI 32-108) with other initial agents although it did not reach statistical significance (p=0.78).
Conclusion: Presence of t(11;14) is associated with an inferior OS compared to patients with normal FISH, trisomies, or other standard risk abnormalities in young patients with MM. Given, the inherent biases associated with a retrospective study from a referral institution, our findings require external validation. However, our data suggest that our current therapeutic approaches in managing young patients with this unique genetic signature are inadequate.
| FISH . | n . | (%) . | Median OS in months (95% CI) . |
|---|---|---|---|
| t(11;14) | 37 | (29) | 76.2 (53.5-107.7) |
| Trisomies | 35 | (28) | 91.3 (76.4-NR) |
| 13/del(13q) | 11 | (9) | NR (32-NR) |
| Normal | 11 | (9) | 95.5 (45.4-95.6) |
| t(4;14) | 11 | (9) | NR (40.1-NR) |
| del(17p)/-17 | 10 | (8) | 42 (19.2-129.6) |
| t(14;16) | 4 | (3) | 77.6 (42.4-NR) |
| Others | 6 | (5) | NR (11.5-NR) |
No relevant conflicts of interest to declare.
Author notes
Asterisk with author names denotes non-ASH members.


This feature is available to Subscribers Only
Sign In or Create an Account Close Modal