Abstract
Background
The Revised International Prognostic Scoring System (IPSS-R) was developed to risk stratify untreated patients (pts) with MDS. It has since been validated in pts treated with a single line of drug therapy, and has been modified in untreated pts to include mutational data; however, these approaches do not reflect typical MDS pts who receive different types of treatment in different sequences. We propose a prognostic model that incorporates mutational data and predicts outcome in pts with primary and secondary MDS regardless of their initial or subsequent treatments.
Methods
Clinical and mutational data of 333 pts with newly diagnosed MDS who were treated at out institution between 1/2000-1/2012 were analyzed. The IPSS-R was calculated at diagnosis. Survival was calculated from the date of diagnosis to last follow up or death. A panel of 62 gene mutations obtained by next generation targeted deep sequencing selected based on the frequency observed in a separate cohort of MDS patients analyzed by whole exome sequencing (WES). A Cox proportional multivariate analysis including age, IPSS-R score and mutations that are present in >/= 10 pts was used to select independent prognostic factors. The fit of the proposed model to the data was assessed by using the Akaike information criterion (AIC).
Results
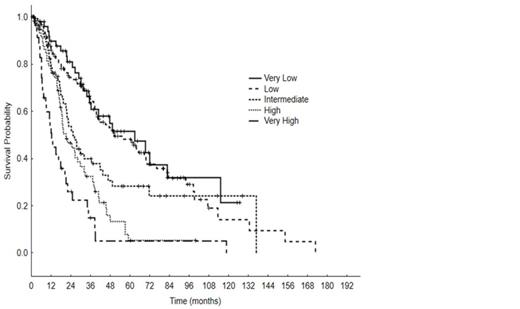
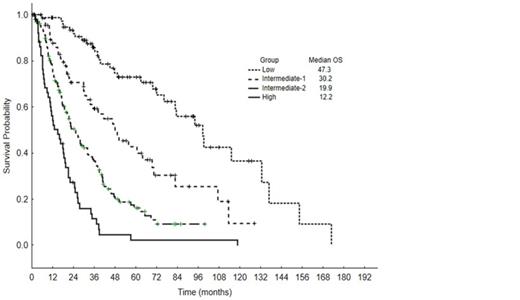
Pt clinical characteristics are summarized in Table 1. Median age was 68 years (range, 20-87); 214 pts (64%) had de novo MDS, 39 (12%) had prior antecedentl hematologic disorders, 37 (11%) secondary MDS, and 43 (13%) had chronic myelomonocytic leukemia (CMML). Pts received between 0-7 lines of therapy: 15% did not receive any treatment, 85% received at least one treatment, 40% received >/=2 treatments, 20% received >/= 3 treatments and 14% of pts eventually underwent hematopoietic cell transplant (HCT). First line therapies included: growth factors (30%), azacitidine +/- combination (32%), decitabine +/- combination (7%), single agent lenalidomide (5%), investigational agents (5%), induction chemotherapy with cytarabine and an anthracycline (7+3, 2%), and immunosuppressive therapy (4%). With a median follow-up of 38 months (mo) (range, 0.4-128.5), 70 pts (21%) progressed to AML and the median OS was 35.1 mo (range, 0.4-128.5). Per IPSS-R risk groups, median OS for very low was 35 mo, low 35 mo, intermediate 22 mo, high 19 mo, and very high 12 mo, Figure 1. Among the 62 gene mutations, 25 were present in >/= 10 pts: TET2 (17%), ASXL1 (15%), SF3B1 (14%), STAG2 (11%), DNMT3A (11%), RUNX1 (10%), U2AF1 (9%), GPR98 (8%), ZRSR2 (7%), BCOR (6%), TP53 (5%), NF1 (5%), EZH2 (5%), APC (5%), SUZ12 (5%), BCORL1 (4%), CBL (4%), PRPF8 (4%), NRAS (3%), CUX1 (3%), DDX54 (3%), IDH2 (3%), KDM6A (3%), PHF6 (3%), and SETBP1 (3%). A Cox proportional hazard analysis including age, IPSS-R score, and the 25 genes mutations listed above identified the following as independent prognostic factors: age, IPSS-R, ASXL1, BCOR, BCORL1, EZH2, IDH2, SF3B1,TP53. The linear predictive Cox model score obtained using the fitted coefficients of each prognostic factor was: ASXL1 X 0.65+BCOR X 0.92+BCORL1 X (-1.65)+EZH2 X 0.71+IDH2 X (-1.0)+SF3B1 X (-0.59)+TP53 X 1.24+Age X 0.04+IPSS-R score X 0.43. Four prognostic groups were proposed: low (score 0-3.4, 80 pts, median OS 47.3 mo), intermediate-1 (score 3.5-4, 69 pts, median OS 30.2 mo), intermediate-2 (score 4.1-5.4, 131 pts, median OS 19.9 mo), and high (score >/= 5.5, 53 pts, median OS 12.2 mo), p < 0.001, Figure 2. The new model demonstrated a markedly better fit, reflected in an AIC of 2026, compared to 2058 for the IPSS-R.
Conclusion
We propose a new mathematical model that incorporates age, IPSS-R score and several gene mutations that can accurately predict OS in pts with primary and secondary MDS as well as CMML regardless of initial or subsequent treatments, including HCT. This model also highlights the importance of mutational data along with clinical data for risk stratification in MDS.
Patient characteristics
| . | No. . | (%) / [Range] . |
|---|---|---|
| Total | 333 | |
| Median age, years | 68 | [20-87] |
| Male | 205 | (62) |
| Female | 128 | (38) |
| Median white blood cell (WBC) X 109/L | 3.8 | [0.69-125.9] |
| Median absolute neutrophil count (ANC) X 109/L | 1.62 | [0.02-170] |
| Median hemoglobin,g/dl | 9.6 | [3.9-14.6] |
| Median platelets X 109/L | 93 | [4-776] |
| Median bone marrow blasts % | 2 | [0-19] |
| IPSS-R | ||
| Very low | 50 | (15) |
| Low | 128 | (38) |
| Intermediate | 59 | (18) |
| High | 60 | (18) |
| Very high | 36 | (11) |
No relevant conflicts of interest to declare.
Author notes
Asterisk with author names denotes non-ASH members.


This feature is available to Subscribers Only
Sign In or Create an Account Close Modal