Abstract
Purpose
To observe the immunological responses of recipients to infused lymphocytes from donors of different genetic backgrounds.
Methods
Mouse models were set up by mating female BALB/c mice with male C57BL mice. Splenic lymphocytes from donors of different genetic backgrounds were labeled with CFSE, and 1∙107 of the cells were intravenously injected into a recipient. At 6, 24, 72 and 120 h after the infusion, mononuclear cells in recipient spleen, liver, thymus, lymph node and peripheral blood were collected, and CFSE+, CFSE-, CD3+, CD8+, CD4+, CD19+, NK1.1+, CD25+, CD127+ lymphocytes in these samples were analyzed by flow cytometry. The distribution of donor T cells, B cells, NK cells, helper T cells, cytotoxic T cells, and recipient regulatory T cells in these tissues were then obtained.
Results
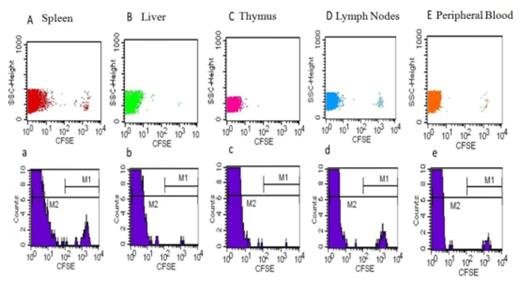
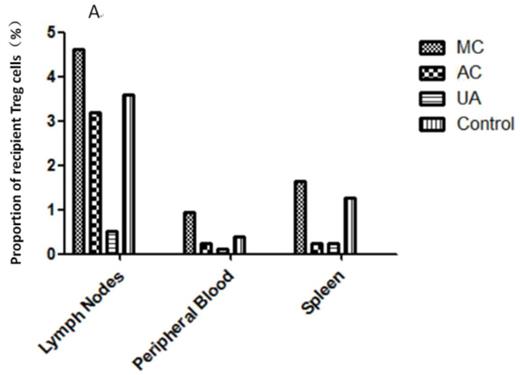
Maternal lymphocytes were more likely to survive in offspring. At 120 h after the infusion, the ratio of maternal cells was 0.52¡À0.11% in lymph node, 0.97¡À0.04% in peripheral blood, and 0.97¡À0.11% in spleen of the offspring. In aunt to child, father to child, and unrelated allogeneic groups at 120 h after the infusion, few donor cells, if any, were detected in these tissues. The subtype proportion of donor lymphocytes changed significantly in recipient tissues. Recipient Treg cells increased in mother to child group but not in aunt to child, father to child, and unrelated allogeneic groups, suggesting the decrease of cellular immune responses to allogeneic cells in mother to child group. At 120 h after the infusion, no donor cells were detected in recipient liver and thymus in all groups, implying that donor cells colonized hardly in liver and thymus.
Conclusion
Specific immune tolerance to maternal lymphocytes existed in offspring. Donor lymphocyte infusion of maternal origin may obtain a relatively persistent effect of adoptive immunotherapy with less side-effect.
CFSE labeled donor splenic lymphocytes were infused to recipients of different kinships
CFSE labeled donor splenic lymphocytes were infused to recipients of different kinships
Black is male C57BL£¨H-2b£©mouse; white are female BALB/c mice (H-2d); the gray is offspring produced by mating C57Bland BALB/c. The lymphocyte infusion relationship between donor and recipient: ¢Ùmother to child group; ¢Úfather to child group; ¢Ûaunt to child group; ¢Üunrelated allogeneic group; ¢Ýsyngeneic group.
The donor cells distribution according to different tissues in a case of mother¡¯ to child group infusion after 120 hours.
The donor cells distribution according to different tissues in a case of mother¡¯ to child group infusion after 120 hours.
M1 are CFSE-positive cells; M2 are the total cells. A. spleen£¨0.97¡À0.11%£©; B. liver£¨0.20¡À0.06%£©; C. thymus£¨0.01¡À0.01%£©; D. lymph nodes£¨0.52¡À0.11%£©; E. peripheral blood£¨0.97¡À0.04%£©
Distribution of Treg cells at 120 h after infusion
Proportion of Treg cells in lymph node, peripheral blood and spleen. Treg cells increased significantly in lymph node, peripheral blood and spleen in mother to child group, as compared with those in aunt to child group, unrelated allogeneic group and control group.
No relevant conflicts of interest to declare.
Author notes
Asterisk with author names denotes non-ASH members.


This feature is available to Subscribers Only
Sign In or Create an Account Close Modal