Key Points
By demonstrating a novel mechanism of regulation of FLN stability by ASB2α, our results point to FLNs and ASB2α as new players in DC biology.
Our data highlight a new degree of complexity in the events that regulate cell motility of immature DCs.
Abstract
The actin-binding protein filamins (FLNs) are major organizers of the actin cytoskeleton. They control the elasticity and stiffness of the actin network and provide connections with the extracellular microenvironment by anchoring transmembrane receptors to the actin filaments. Although numerous studies have revealed the importance of FLN levels, relatively little is known about the regulation of its stability in physiological relevant settings. Here, we show that the ASB2α cullin 5-ring E3 ubiquitin ligase is highly expressed in immature dendritic cells (DCs) and is down-regulated after DC maturation. We further demonstrate that FLNs are substrates of ASB2α in immature DCs and therefore are not stably expressed in these cells, whereas they exhibit high levels of expression in mature DCs. Using ASB2 conditional knockout mice, we show that ASB2α is a critical regulator of cell spreading and podosome rosette formation in immature DCs. Furthermore, we show that ASB2−/− immature DCs exhibit reduced matrix-degrading function leading to defective migration. Altogether, our results point to ASB2α and FLNs as newcomers in DC biology.
Introduction
Cytoskeletal reorganization and response to mechanical stimuli are critical determinants of cell growth, stem-cell lineage switching, differentiation, or tissue morphogenesis and maintenance.1 These depend on the coherence of the filamentous actin (F-actin) network.2 In particular, actin-binding proteins are crucial in recruiting F-actin into 3-dimensional networks. Among them, filamin A (FLNa) mediates cross-linking of cytoplasmic actin into a dynamic structure resulting in an elastic network.3-6 In addition to organizing F-actin, FLNa participates in the anchoring of several transmembrane receptors including integrins to the actin cytoskeleton, providing mechanical stability to the cell membrane and cell-cell or cell-extracellular matrix (ECM) connections.7,8 Integrins, but also FLNa, behave as mechanosensors that transduce forces and convert them into chemical responses.9,10 Furthermore, FLNa binds numerous signaling molecules and modulates their activity that, in turn, regulates actin assembly and disassembly.7
Mammals have 3 highly conserved FLNs, FLNa, FLNb, and FLNc, that have a wide tissue expression, although FLNc is more restricted to striated muscles in adults. Mutations in any of the human FLNs are associated with a wide spectrum of developmental malformations and diseases.7 All 3 FLNs are implicated in several aspects of cell shape and motility. Indeed, FLN concentration is a crucial determinant in the stiffness of the actin filament network,11,12 in cell spreading,13-15 in cell adhesion,15,16 in cell migration,17-19 and in invasion of cancer cells.20,21 In this context, deciphering the mechanisms controlling levels of FLN may have broad implications for our understanding of FLN functions in normal cells and dysfunctions in pathological contexts. FLN stability is regulated by proteolysis through cleavages by calpains22 and ubiquitin-mediated proteasomal degradation controlled by the ASB2 E3 ubiquitin ligases.13,17,23 Two ASB2 isoforms have been described: ASB2α and ASB2β that are involved in hematopoietic13,24 and myogenic23 differentiation, respectively. Indeed, ASB2 proteins are the specificity subunits of cullin 5-ring E3 ubiquitin ligase complexes involved in the polyubiquitylation and subsequent degradation of specific substrates.23,25,26 We have demonstrated previously that ASB2α triggers polyubiquitylation and drives proteasome-mediated degradation of all 3 FLNs.13,17,27
Although ASB2α was originally identified as induced on retinoic acid differentiation of acute promyelocytic leukemia cells,24,28 several observations have suggested that ASB2 transcripts are also expressed in dendritic cells (DCs).29-31 DCs play a central role in activation of primary immune responses. Immature DCs are located in nonlymphoid organs where they survey the microenvironment in search of antigens, including pathogens, foreign antigens, or self-antigens, or in the marginal zone of the spleen. On exposure to inflammatory stimuli, DCs of nonlymphoid organs initiate a tightly regulated maturation process that includes (i) a transient increase of macropinocytosis and phagocytosis32 ; (ii) a transient decrease of cell motility33 ; (iii) the accumulation of major histocompatibility complex (MHC)-II-peptide complexes at the cell surface34 ; and (iv) a decrease of cell-ECM adhesion followed by a chemoattractive migration to the draining lymph nodes.35 During these processes, DCs undergo profound changes in actin cytoskeleton. Maturation is often triggered by the ligation of Toll-like receptors (TLRs) that initiate different signaling pathways in response to pathogen-associated molecular patterns.36 Some TLRs such as TLR4, the receptor for lipopolysaccharide (LPS), are present at the plasma membrane, whereas others are in the endosomal compartment. Although the cell biology associated with DC maturation has been partly described, much remains to be learned about the molecular mechanisms controlling cytoskeletal rearrangements and adhesion and migration of immature DCs. Immature DCs harbor adhesion complexes known as podosomes that consist of a core of F-actin and actin-regulatory proteins surrounded by a ring of other proteins including integrins and talin.37-39 Podosomes represent not only sites of attachment to the ECM but also sites of degradation of this matrix.40
Here, we show that ASB2α is highly expressed in immature DCs and targets FLNa and FLNb to proteasomal degradation. Furthermore, using ASB2α knockout bone marrow–derived DCs (BMDCs), we investigate the role of ASB2α in immature DCs and show that ASB2α is essential to regulate cell spreading, podosome formation, ECM degradation, and migration.
Materials and methods
Animals
All mice were bred under specific pathogen-free conditions and were handled according to institutional guidelines under protocols approved by the Institut de Pharmacologie et de Biologie Structurale (IPBS) and Région Midi-Pyrénées animal care committees. C57BL/6 mice were from Charles Rivers. The ASB2fl/+ mouse line was established at the Mouse Clinical Institute/Institut Clinique de la Souris (MCI/ICS), Illkirch, France (http://www.ics-mci.fr/). The targeting vector was constructed as follows: a 4.0-kb fragment encompassing intron 1, exon 1, and an extending upstream of exon 1 was amplified by polymerase chain reaction (PCR) using 129S2/SvPas DNA as a template and was subcloned in an MCI proprietary vector, resulting in step 1 plasmid. This MCI vector has a neomycin resistance cassette located between 2 flippase recombination target (FRT) sites. A 4.1-kb fragment encompassing intron 4, exon 5, and an extending downstream of intron 5 was amplified by PCR and was subcloned in step 1 plasmid. Finally, a 3.-kb fragment encompassing exons 2 to 4 was amplified by PCR and subcloned in step 2 plasmid between 2 loxP sites to generate the final targeting construct. The linearized construct was electroporated in 129S2/SvPas mouse embryonic stem (ES) cells. After selection, targeted clones were identified by PCR and were further confirmed by Southern blot. A positive ES clone bearing the L3-targeted allele was injected into C57BL/6J blastocysts, and 1 chimaera was bred with C57BL/6 mice to obtain ASB2L3/+ mice. These mice were crossed with flippase transgenic mice to excise the FRT site-flanked NeoR cassette and create mice with 1 conditional floxed allele. ASB2fl/+ mice were further backcrossed at least 6 generations in a purebred C57BL/6 background and crossbred to produce ASB2fl/fl mice.
ASB2fl/+ mice were crossed with Mx1-CRE C57BL/6 transgenic mice,41 producing Mx1-CRE;ASB2fl/+ offspring. These mice were then crossed with ASB2fl/fl mice, producing the Mx1-CRE;ASB2fl/fl mice. Mice were genotyped by PCR of DNA isolated from tails or BM cells using the REDExtract-N-Amp Tissue PCR Kit (Sigma), according to the manufacturer’s instructions. Primers used were (A) 5′-CAATCTCTCCCTGGTAGAAACAGTTTGG-3′; (B) 5′-CAGTGTCTGCTCTGAGGTCTCTC-3′; and (C) 5′-CTAGATAGCTCTACAGCTAATTCCG-3′. Mx1-Cre mice were genotyped by PCR with primers 5′-TCCCAACCTCAGTAGCAAGCCAAG-3′ and 5′-ACGACCGGCAAACGGACAGAAGCA-3′. To induce ASB2 knockout in adult animals, 300 μg poly(I·C) (Sigma) was injected 3 times at 2-day intervals to 6- to 8-week-old Mx1-Cre;ASB2fl/fl and Mx1-Cre;ASB2+/+ control mice. Mice were analyzed 6 weeks after the last injection to avoid adverse effects of poly(I·C).
Generation of BMDCs and spleen-derived DCs
To generate BMDCs, freshly dissected femurs and tibias were flushed with phosphate-buffered saline (PBS). Cells were spun for 5 minutes at 300 × g and were cultured for 10 days in Iscove modified Dulbecco medium (IMDM) containing 10% fetal bovine serum (FBS; Biowest), granulocyte-macrophage colony-stimulating factor–containing supernatant obtained from J558 cells, 1% l-glutamine, 1% penicillin-streptomycin, and 0.1% β-mercaptoethanol (Invitrogen). Spleen-derived DCs were obtained as described.32 Briefly, sterile isolated spleen cells were recovered, and after red blood cell lysis, cells were spun for 5 minutes at 300 × g and were cultured for 14 days in IMDM containing 10% FBS (Biowest), granulocyte-macrophage colony-stimulating factor–containing supernatant obtained from J558 cells, 1% l-glutamine, 1% penicillin-streptomycin, 1 ng/mL of human transforming growth factor-β1, and 0.1% β-mercaptoethanol (Invitrogen). BMDCs were activated in IMDM containing 10% FBS, 1% l-glutamine, 1% penicillin-streptomycin, and 0.1% β-mercaptoethanol with 10 μg/mL of LPS (Sigma). The phenotype of DCs and their activation were analyzed by fluorescence-activated cell sorter (FACS).
Northern blots and quantitative reverse transcription (RT)-PCR
Total RNA was extracted using the NucleoSpin RNA II kit (Macherey-Nagel). Northern blotting was performed as described.42 The ASB2 probe corresponds to a region common to both ASB2 isoforms. Quantitative RT-PCR was performed as described.23 Primers for the detection of mouse ASB2 mRNAs and mouse FLNa mRNA were designed based on chromosome sequences according to the requirements for real-time RT-PCR. Oligonucleotide primer sequences corresponding to distinct exons were as follows: forward 5′-CACTCTGGCTCTGCACCTTC-3′ and reverse 5′-GGGCTCTGCAAGATTCTTCC-3′ for ASB2α; forward 5′-TTGTTGCCCAGACCT-3′ and reverse 5′-TCTCCTCCAGCTTCCAG-3′ for ASB2β; forward 5′-CACTTTACAAAGCCTGTGAG-3′ and reverse 5′-AGGATCTCCATGACCTCC-3′ common to both ASB2 isoforms; forward 5′-GCTATCGTGTCACCTATACC-3′ and reverse 5′-GAACCGTGGCAACTTTAGTC-3′ for FLNa; forward 5′-CGCGTCCTGGCATTGTCTG-3′ and reverse 5′-GGCCTTGACCTTTTCAGTAAGTG-3′ for Arbp.
In vivo expression and protein extracts
The pEGFP-C3-mASB2α and pEGFP-C3-mASB2αLA vectors expressing wild-type and the E3 ubiquitin ligase–defective mutant (mutation of leucine 547 to an alanine) of mouse ASB2α were constructed by standard procedures. NIH3T3 cells were grown in Dulbecco modified Eagle medium containing 4.5 g/L of glucose (Invitrogen), 10% FBS (PAA Laboratories), and penicillin-streptomycin. NIH3T3 cells were transfected using the Jet PEI reagent (Polyplus transfection) as recommended by the manufacturer. Cells were washed twice in PBS and were lysed in whole-cell extract buffer-containing 50 mM of Tris-HCl, pH 7.9, 150 mM of NaCl, 1 mM of EDTA, 0.1% Nonidet P-40, 10% glycerol, 1 mM of dithiothreitol, 1 mM of Na3VO4, 50 mM of NaF, 25 mM of β-glycerophosphate, 2 mM of sodium pyrophosphate, and 1% protease inhibitor cocktail (P8340; Sigma). After 2 freeze-thaw cycles in liquid nitrogen, the resulting cell lysates were cleared by a 10-minute 20 000 × g centrifugation at 4°C.
Antibodies, immunofluorescence microscopy, and flow cytometry
Anti-FLNb (N-16), anti-vinculin (h-VIN1), and anti-α-actinin-1 (clone AT6.172) were from Santa Cruz Biotechnology, Sigma, and Millipore, respectively. The anti-human FLNa antiserum that cross-reacts with mouse FLNa and used for western blot and immunofluorescence experiments has been described previously.13 Immunoblot analyses and immunofluorescence microscopy studies were performed as described.13,16 Images were acquired using a Zeiss Axio Imager M2 with a ×40/1.3 oil Ph3 or a ×63/1.3 oil DIC Plan Apochromat objective (Zeiss). Images were acquired and processed using AxioVision software and an AxioCam MRm camera (Zeiss). F-actin was visualized with Alexa 633-phalloidin or Alexa 546-phalloidin (Invitrogen). Quantification of FLNa expression by FACS was performed as described.26 For flow cytometry, APC-anti-CD11c, PE-anti-CD86 and PE-anti-I-A[b] (Biolegend) were used. Samples were analyzed using a LSRII cytometer (Becton-Dickinson).
Cell spreading, gelatin-fluorescein isothiocyanate (FITC) degradation, and migration assay
Gelatin-coated coverslips were prepared as described.43 Immature BMDCs were harvested, washed in PBS, and rested in suspension in serum-free medium containing 0.2% bovine serum albumin for 1 hour at 37°C. Cells were then plated on glass coverslips coated with 50 μg/mL of fibronectin (BD Biosciences) for 30 minutes at 37°C or with 0.2 mg/mL of gelatin-FITC (BD Biosciences) for 6 hours at 37°C. Cells were then fixed with 4% paraformaldehyde, 15 mM of sucrose in PBS. Cell areas, degradation areas, and fluorescence intensities were measured using AxioVision software. For quantitative analyses, the total degradation areas of 50 image fields for each sample were calculated. Rested BMDCs were seeded on matrigel-coated transwell filters (6-well format, 8-µm pore size; BD Biosciences) at a density of 2.5 × 10⁶ cells/well and were incubated at 37°C. Cells that had migrated after 16 hours to the bottom compartment were counted using trypan blue exclusion and were analyzed by immunofluorescence microscopy and by flow cytometry for CD11c expression.
Statistical analyses
P values were calculated with the Mann-Whitney t test.
Results
ASB2α expression in immature DCs correlates with loss of FLNa and FLNb
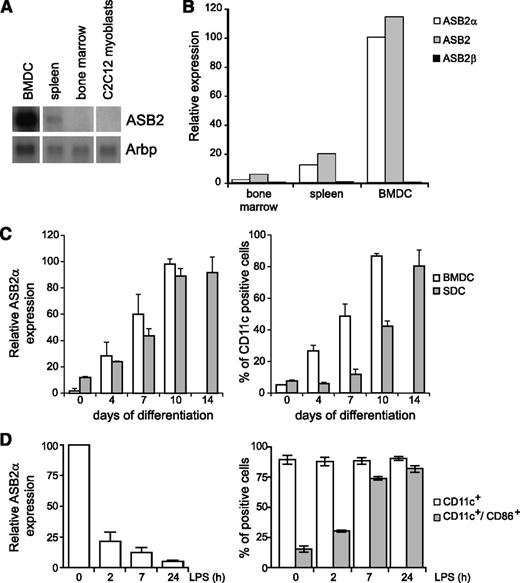
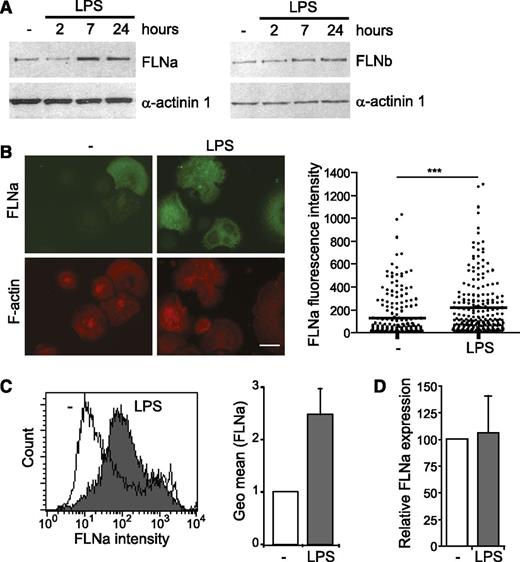
Although we and others have reported that ASB2α is expressed on induced maturation of myeloid leukemia cells,24,44,45 microarray studies indicated that ASB2 is also expressed in human DCs purified from blood,30 as well as in mouse classical DCs isolated from lymphoid or nonlymphoid tissues.29,31 We first evaluated the expression of ASB2 mRNAs in BMDCs. As shown in Figure 1A, ASB2 transcripts were highly expressed in immature DCs and, to a lesser extent, in the spleen and BM. By quantitative RT-PCR with primers specific to ASB2α, ASB2β, or with primers common to both isoforms, we demonstrated that only the ASB2α mRNAs were expressed in immature DCs (Figure 1B). Indeed, ASB2α transcripts were barely detected in BM cells and were progressively increased as cells differentiated into immature DCs in the presence of granulocyte macrophage–CSF (Figure 1C). Expression of ASB2α mRNAs were also observed in primary DCs derived from the spleen (Figure 1D). Interestingly, ASB2α expression was drastically down-regulated during maturation stimulated by LPS (Figure 1D). This downregulation was also observed when DC maturation was triggered by other activating agents (data not shown). We demonstrated previously that the ASB2α protein targets all 3 FLNs for proteasomal degradation.13,17,27 Therefore, we investigated the expression of the ubiquitously expressed FLNa and FLNb in DCs. Western blotting revealed that expression of FLNa and FLNb was increased after exposure of immature DCs to LPS (Figure 2A). Expression of FLNa was also analyzed by immunofluorescence microscopy to visualize and quantify at the single-cell level the impact of LPS activation on FLNa expression (Figure 2B). Indeed, the median value of FLNa fluorescence intensities was increased in mature DCs compared with immature DCs. To further confirm these data, we determined the expression of FLNa by FACS analysis, which demonstrated that FLNa expression was higher in mature DCs than in immature DCs (Figure 2C). However, the abundance of FLNa mRNA in DCs was similar in immature DCs or in DCs cultured with LPS (Figure 2D). These findings are consistent with the downregulation of ASB2α on DC activation and suggest that the abundance of FLNa and FLNb is regulated by the ASB2α E3 ubiquitin ligase complex in DCs.
ASB2α is expressed in immature DCs and is down-regulated on their activation. (A) Autoradiogram of ASB2 mRNA expression in mouse BMDCs, spleen, BM, and C2C12 myoblasts as a negative control. Northern blot was performed with 4 μg of total RNA. Arbp was used for assessment of RNA quantities in each lane. (B) Relative expression of ASB2 mRNAs in BM, spleen, and BMDCs. Quantitative real-time RT-PCR was carried out with primers specific to ASB2α, ASB2β, or common to both isoforms. (C) BMDCs and spleen-derived DCs were obtained as described in the Materials and methods section. Relative expression of ASB2α mRNAs in BM cells or in spleen cells induced to differentiate into DCs (left panel). Quantitative real-time RT-PCR was carried out with ASB2α-specific primers. Cells were stained with antibodies to CD11c for flow cytometry as assessment of differentiation (right panel). (D) Relative expression of ASB2α mRNAs during LPS-induced BMDC activation (left panel). Immature BMDCs were treated with LPS as indicated. Quantitative real-time RT-PCR was carried out with ASB2α-specific primers. BMDC activation was monitored by flow cytometry with antibodies directed against CD11c and CD86 (right panel). In C and D, data show means and standard error of the mean (SEM) of at least 3 independent experiments.
ASB2α is expressed in immature DCs and is down-regulated on their activation. (A) Autoradiogram of ASB2 mRNA expression in mouse BMDCs, spleen, BM, and C2C12 myoblasts as a negative control. Northern blot was performed with 4 μg of total RNA. Arbp was used for assessment of RNA quantities in each lane. (B) Relative expression of ASB2 mRNAs in BM, spleen, and BMDCs. Quantitative real-time RT-PCR was carried out with primers specific to ASB2α, ASB2β, or common to both isoforms. (C) BMDCs and spleen-derived DCs were obtained as described in the Materials and methods section. Relative expression of ASB2α mRNAs in BM cells or in spleen cells induced to differentiate into DCs (left panel). Quantitative real-time RT-PCR was carried out with ASB2α-specific primers. Cells were stained with antibodies to CD11c for flow cytometry as assessment of differentiation (right panel). (D) Relative expression of ASB2α mRNAs during LPS-induced BMDC activation (left panel). Immature BMDCs were treated with LPS as indicated. Quantitative real-time RT-PCR was carried out with ASB2α-specific primers. BMDC activation was monitored by flow cytometry with antibodies directed against CD11c and CD86 (right panel). In C and D, data show means and standard error of the mean (SEM) of at least 3 independent experiments.
Expression of FLNa and FLNb in immature and mature DCs. (A) Expression of FLNa, FLNb, and α-actinin 1 was analyzed by western blot using 15-μg aliquots of whole-cell extracts of untreated (-) and LPS-treated BMDCs as indicated. (B) Expression of FLNa was assessed by immunofluorescence in immature BMDCs cultured without (-) or with LPS for 24 hours. Cells were harvested, centrifuged onto poly-l-lysine–coated glass coverslips, fixed, stained for FLNa and phalloidin, and imaged (left panel). Dot plots show the overall distribution of relative FLNa fluorescence intensities, and lines show the median values (right panel). Scale bar represents 20 μm. (C) Expression of FLNa was assessed by flow cytometry in immature BMDCs cultured without (-) or with LPS for 24 hours. After fixation and permeabilization, cells were stained with anti-FLNa and alexa Fluor 488-conjugated anti-rabbit antibodies. White and gray areas show representative staining profiles of immature and LPS-treated BMDCs, respectively (left panel). The relative quantification of FLNa expression in untreated and LPS-treated BMDCs is shown as means and standard deviation (SD) of 3 independent experiments (right panel). (D) Relative expression of FLNa mRNAs in untreated (-) and LPS-treated BMDCs assessed by quantitative real-time RT-PCR. Levels were normalized to Arbp. The data show means and SEM of 3 independent experiments. ***P < .001.
Expression of FLNa and FLNb in immature and mature DCs. (A) Expression of FLNa, FLNb, and α-actinin 1 was analyzed by western blot using 15-μg aliquots of whole-cell extracts of untreated (-) and LPS-treated BMDCs as indicated. (B) Expression of FLNa was assessed by immunofluorescence in immature BMDCs cultured without (-) or with LPS for 24 hours. Cells were harvested, centrifuged onto poly-l-lysine–coated glass coverslips, fixed, stained for FLNa and phalloidin, and imaged (left panel). Dot plots show the overall distribution of relative FLNa fluorescence intensities, and lines show the median values (right panel). Scale bar represents 20 μm. (C) Expression of FLNa was assessed by flow cytometry in immature BMDCs cultured without (-) or with LPS for 24 hours. After fixation and permeabilization, cells were stained with anti-FLNa and alexa Fluor 488-conjugated anti-rabbit antibodies. White and gray areas show representative staining profiles of immature and LPS-treated BMDCs, respectively (left panel). The relative quantification of FLNa expression in untreated and LPS-treated BMDCs is shown as means and standard deviation (SD) of 3 independent experiments (right panel). (D) Relative expression of FLNa mRNAs in untreated (-) and LPS-treated BMDCs assessed by quantitative real-time RT-PCR. Levels were normalized to Arbp. The data show means and SEM of 3 independent experiments. ***P < .001.
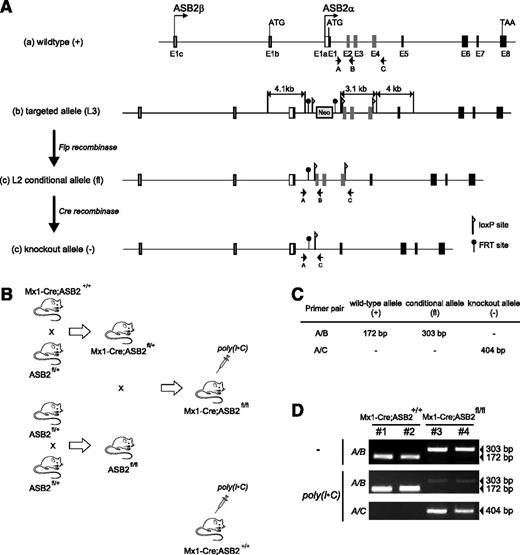
Creation of conditional ASB2 knockout mice. (A) Schematic representation of (a) the wild-type allele (+) of the mouse ASB2 gene, (b) the structure of the correctly targeted allele with the introduced neomycin resistance cassette and loxP and FRT sites, (c) the conditional floxed allele (fl) produced by Flp-enhanced recombinase-mediated recombination of FRT sites flanking Neo, and (d) the deleted allele (−) produced by Cre recombination of loxP sites surrounding exons 2 to 4. The locations of genotyping primers are also indicated. (B) Schematic representation of the cross-breedings performed to generate Mx1-Cre;ASB2fl/fl mice as described in the Materials and methods section and inducible Cre-mediated disruption of ASB2 in Mx1-Cre;ASB2fl/fl mice after poly(I·C) administration. Mx1-Cre;ASB2+/+ mice that have received poly(I·C) are used as controls (ASB2+/+). (C) Predicted PCR fragment sizes for wild-type (+), floxed (flox), and knockout (−) alleles of ASB2 using primer sets shown in A. (D) PCR products from mouse tail DNA using primers A, B, and C for the genotyping of ASB2 in 2 Mx1-Cre;ASB2+/+ and 2 Mx1-Cre;ASB2fl/fl mice before (-) and 6 weeks after the last poly(I·C) injection.
Creation of conditional ASB2 knockout mice. (A) Schematic representation of (a) the wild-type allele (+) of the mouse ASB2 gene, (b) the structure of the correctly targeted allele with the introduced neomycin resistance cassette and loxP and FRT sites, (c) the conditional floxed allele (fl) produced by Flp-enhanced recombinase-mediated recombination of FRT sites flanking Neo, and (d) the deleted allele (−) produced by Cre recombination of loxP sites surrounding exons 2 to 4. The locations of genotyping primers are also indicated. (B) Schematic representation of the cross-breedings performed to generate Mx1-Cre;ASB2fl/fl mice as described in the Materials and methods section and inducible Cre-mediated disruption of ASB2 in Mx1-Cre;ASB2fl/fl mice after poly(I·C) administration. Mx1-Cre;ASB2+/+ mice that have received poly(I·C) are used as controls (ASB2+/+). (C) Predicted PCR fragment sizes for wild-type (+), floxed (flox), and knockout (−) alleles of ASB2 using primer sets shown in A. (D) PCR products from mouse tail DNA using primers A, B, and C for the genotyping of ASB2 in 2 Mx1-Cre;ASB2+/+ and 2 Mx1-Cre;ASB2fl/fl mice before (-) and 6 weeks after the last poly(I·C) injection.
FLNa and FLNb are substrates of the ASB2α E3 ubiquitin ligase complex in immature DCs
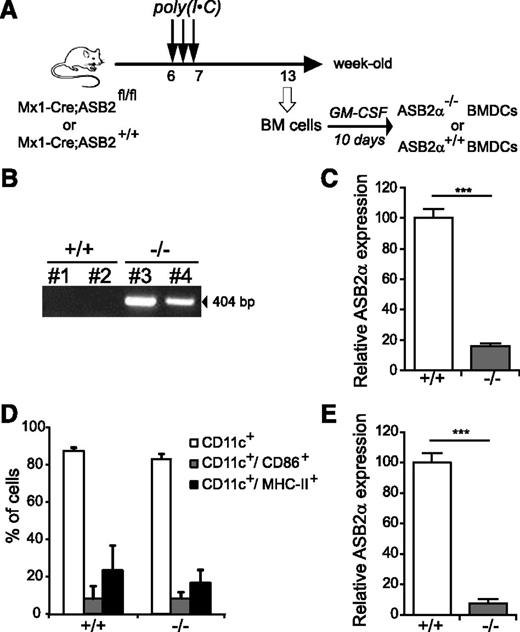
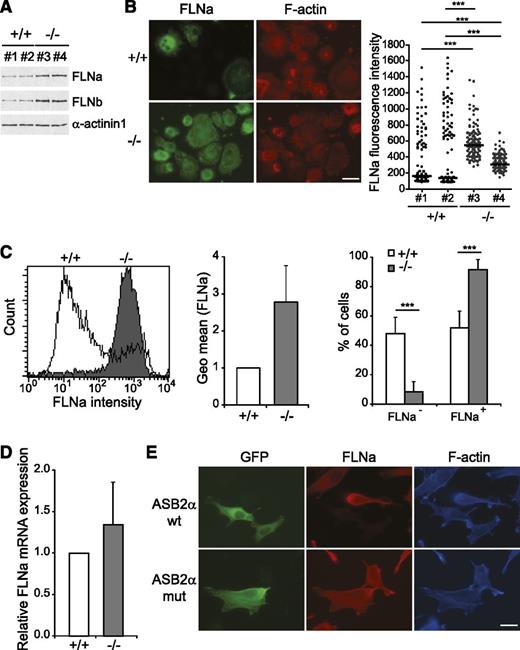
To investigate ASB2 functions, we generated conditional gene-targeted mice with exons 2 and 4 flanked by a pair of loxP sequences (Figure 3). To examine whether ASB2α is important during the differentiation of DCs from BM cultures, we cross-bred ASB2fl/fl mice with transgenic Mx1-Cre mice to allow inducible ASB2 inactivation in hematopoietic stem and progenitor cells (Figure 4A). ASB2 deletion was analyzed 6 weeks after the third administration of poly(inosinic acid)·poly(cytidylic acid) [poly(I·C)] to young adult mice by PCR analyses of genomic DNA, which confirmed the presence of the inactivated allele in the tail (Figure 3) and in BM cells (Figure 4B) of Mx1-Cre;ASB2fl/fl mice but not of Mx1-Cre;ASB2wt/wt control mice. Expression of ASB2α in BM cells of Mx1-Cre;ASB2fl/fl mice was decreased compared with BM cells of control Mx1-Cre;ASB2wt/wt mice after poly(I·C) administration (Figure 4C). However, DCs were obtained from each culture (Figure 4D), indicating that ASB2α is dispensable for the generation of BMDCs. As expected, expression of ASB2α was drastically decreased in DCs generated from BM cells of Mx1-Cre;ASB2fl/fl mice that have received poly(I·C) (Figure 4E; hereafter referred to as ASB2α−/− DCs). In addition, surface expression of activation markers CD86 and MHC-II were indistinguishable between ASB2α−/− and ASB2α+/+ immature DCs (Figure 4D). We then investigated the expression of FLNs in ASB2α−/− immature DCs. As shown in Figure 5A, western blotting showed that the levels of FLNa and FLNb were higher in ASB2α−/− DCs than in ASB2α+/+ DCs. This finding was further confirmed by immunofluorescence and FACS analyses (Figure 5B-C). Because levels of FLNa transcripts were similar in ASB2α−/− and ASB2α+/+ DCs (Figure 5D), our results demonstrated that ASB2α regulates FLN abundance in immature DCs. As previously observed for the human ASB2α proteins,13 the mouse ASB2α, but not the ASB2αLA E3 ubiquitin ligase–defective mutant, induced degradation of FLNa (Figure 5E). These results demonstrate that ASB2α targets FLNa and FLNb to proteasomal degradation in immature DCs.
ASB2α is dispensable for the generation of BMDCs. (A) Experimental outline of ASB2 deletion and generation of ASB2α−/− BMDCs. (B) PCR products from mouse BM DNA of 2 Mx1-Cre;ASB2+/+ (+/+) and 2 Mx1-Cre;ASB2fl/fl (−/−) mice after poly(I·C) administration using primers A and C, allowing the amplification of the knockout allele (Figure 3). (C) Relative expression of ASB2α mRNAs in BM cells of ASB2+/+ and ASB2−/−. (Sample size: +/+ = 22; −/− = 24). (D) Expression of CD11c, CD86, and MHC-II at the cell surface of ASB2α−/− and ASB2α+/+ BMDCs. (Sample size: +/+ = 16 and −/− = 16 for CD11c; +/+ = 14 and −/− = 14 for CD86; +/+ = 7 and −/− = 7 for MHC-II). (E) Relative expression of ASB2α mRNAs in BMDCs generated from BM cells of ASB2+/+ and ASB2−/−. (Sample size: +/+ = 22; −/− = 25). ***P < .001.
ASB2α is dispensable for the generation of BMDCs. (A) Experimental outline of ASB2 deletion and generation of ASB2α−/− BMDCs. (B) PCR products from mouse BM DNA of 2 Mx1-Cre;ASB2+/+ (+/+) and 2 Mx1-Cre;ASB2fl/fl (−/−) mice after poly(I·C) administration using primers A and C, allowing the amplification of the knockout allele (Figure 3). (C) Relative expression of ASB2α mRNAs in BM cells of ASB2+/+ and ASB2−/−. (Sample size: +/+ = 22; −/− = 24). (D) Expression of CD11c, CD86, and MHC-II at the cell surface of ASB2α−/− and ASB2α+/+ BMDCs. (Sample size: +/+ = 16 and −/− = 16 for CD11c; +/+ = 14 and −/− = 14 for CD86; +/+ = 7 and −/− = 7 for MHC-II). (E) Relative expression of ASB2α mRNAs in BMDCs generated from BM cells of ASB2+/+ and ASB2−/−. (Sample size: +/+ = 22; −/− = 25). ***P < .001.
FLNa and FLNb are substrates of the ASB2α E3 ubiquitin ligase complex in DCs. (A) Expression of FLNa, FLNb, and α-actinin 1 was analyzed by western blot using 15-μg aliquots of whole-cell extracts of ASB2α−/− and ASB2α+/+ BMDCs from 2 independent cell cultures as indicated. (B) Expression of FLNa was assessed by immunofluorescence in ASB2α−/− and ASB2α+/+ BMDCs. Cells were harvested, centrifuged onto poly-l-lysine–coated glass coverslips, fixed, stained for FLNa and phalloidin, and imaged (left panel). Scale bar represents 20 μm. Dot plots show the overall distribution of relative FLNa fluorescence intensities, and lines show the median values (right panel). (C) Histograms show FLNa expression in ASB2α−/− and ASB2α+/+ BMDCs (left panel). The relative quantification of FLNa expression in ASB2α−/− and ASB2α+/+ BMDCs is shown as means and SD (middle panel). (Sample size: +/+ = 19; −/− = 26). Right panel shows the percentages of FLNa-negative and FLNa-positive BMDCs as means and SD. (Sample size: +/+ = 24; −/− = 26). (D) Relative expression of FLNa mRNAs in ASB2α−/− and ASB2α+/+ BMDCs assessed by quantitative real-time RT-PCR. Levels were normalized to Arbp. (E) Mouse ASB2α E3 ubiquitin ligase activity is required for FLNa degradation. NIH3T3 cells were transfected with GFP-mASB2α (ASB2α wt) or GFP-mASB2αLA (ASB2α mut) expression vectors and were analyzed 48 hours after transfection using an antibody directed against FLNa and phalloidin. Scale bar represents ***P < .001.
FLNa and FLNb are substrates of the ASB2α E3 ubiquitin ligase complex in DCs. (A) Expression of FLNa, FLNb, and α-actinin 1 was analyzed by western blot using 15-μg aliquots of whole-cell extracts of ASB2α−/− and ASB2α+/+ BMDCs from 2 independent cell cultures as indicated. (B) Expression of FLNa was assessed by immunofluorescence in ASB2α−/− and ASB2α+/+ BMDCs. Cells were harvested, centrifuged onto poly-l-lysine–coated glass coverslips, fixed, stained for FLNa and phalloidin, and imaged (left panel). Scale bar represents 20 μm. Dot plots show the overall distribution of relative FLNa fluorescence intensities, and lines show the median values (right panel). (C) Histograms show FLNa expression in ASB2α−/− and ASB2α+/+ BMDCs (left panel). The relative quantification of FLNa expression in ASB2α−/− and ASB2α+/+ BMDCs is shown as means and SD (middle panel). (Sample size: +/+ = 19; −/− = 26). Right panel shows the percentages of FLNa-negative and FLNa-positive BMDCs as means and SD. (Sample size: +/+ = 24; −/− = 26). (D) Relative expression of FLNa mRNAs in ASB2α−/− and ASB2α+/+ BMDCs assessed by quantitative real-time RT-PCR. Levels were normalized to Arbp. (E) Mouse ASB2α E3 ubiquitin ligase activity is required for FLNa degradation. NIH3T3 cells were transfected with GFP-mASB2α (ASB2α wt) or GFP-mASB2αLA (ASB2α mut) expression vectors and were analyzed 48 hours after transfection using an antibody directed against FLNa and phalloidin. Scale bar represents ***P < .001.
ASB2α regulates spreading and adhesive structures in immature DCs
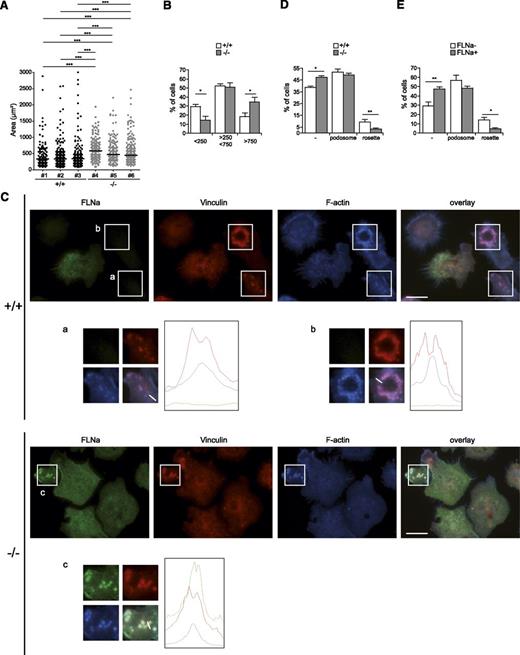
Critical to DC function in the initiation of an immune response is the ability to scan tissues in search of antigens. This mechanism involves morphologic changes and cell movement through the microenvironment. Through expression of exogenous ASB2α, we provided the first evidence that loss of FLNa and FLNb inhibited cell spreading on fibronectin.13,17 This finding led us to investigate the cell spreading of ASB2α−/− immature DCs to a fibronectin-coated surface. Indeed, the cell area of ASB2α−/− immature DCs allowed to spread onto fibronectin-coated coverslips was increased compared with that of ASB2α+/+ immature DCs (Figure 6A). More precisely, the number of cells with a small area (<250 μm2) was reduced in ASB2α−/− immature DCs (Figure 6B). These results demonstrate for the first time that ASB2α regulates cell spreading in physiological relevant settings.
ASB2α regulates cell spreading and podosome formation in DCs. (A-B) ASB2α−/− and ASB2α+/+ BMDCs were harvested, serum arrested for 1 hour in suspension, plated on fibronectin-coated coverslips, and fixed after 30 minutes. Cell areas of at least 100 cells were measured. Dot plots show the overall distribution, and lines show the median values. The percentage of cells with an area inferior to 250 µm2, comprising between 250 and 750 µm2 and superior to 750µm2, were calculated. The data show means and SEM. (Sample size: +/+ = 5; −/− = 7). (C-E) ASB2α−/− and ASB2α+/+ BMDCs were harvested; serum arrested for 1 hour in suspension; plated on glass coverslips; fixed after 30 minutes; stained for FLNa, vinculin, and phalloidin; and then imaged. Scale bar represents 20 μm. Diagrams depict the intensity of the fluorescence for each staining along lines drawn on the enlarged overlay images. Percentages of cells with no adhesive structures (-), with individual podosomes (shown in the enlarged images a and c), or podosomes organized as rosettes (shown in the enlarged image b) were calculated in ASB2α−/− and ASB2α+/+ BMDCs (C) and in FLNa-negative (FLNa−) or FLNa-positive (FLNa+) ASB2α+/+ BMDCs (D). The data show means and SEM. (Sample size: +/+ = 5; −/− = 6). *P < .05; **P < .01; ***P < .001.
ASB2α regulates cell spreading and podosome formation in DCs. (A-B) ASB2α−/− and ASB2α+/+ BMDCs were harvested, serum arrested for 1 hour in suspension, plated on fibronectin-coated coverslips, and fixed after 30 minutes. Cell areas of at least 100 cells were measured. Dot plots show the overall distribution, and lines show the median values. The percentage of cells with an area inferior to 250 µm2, comprising between 250 and 750 µm2 and superior to 750µm2, were calculated. The data show means and SEM. (Sample size: +/+ = 5; −/− = 7). (C-E) ASB2α−/− and ASB2α+/+ BMDCs were harvested; serum arrested for 1 hour in suspension; plated on glass coverslips; fixed after 30 minutes; stained for FLNa, vinculin, and phalloidin; and then imaged. Scale bar represents 20 μm. Diagrams depict the intensity of the fluorescence for each staining along lines drawn on the enlarged overlay images. Percentages of cells with no adhesive structures (-), with individual podosomes (shown in the enlarged images a and c), or podosomes organized as rosettes (shown in the enlarged image b) were calculated in ASB2α−/− and ASB2α+/+ BMDCs (C) and in FLNa-negative (FLNa−) or FLNa-positive (FLNa+) ASB2α+/+ BMDCs (D). The data show means and SEM. (Sample size: +/+ = 5; −/− = 6). *P < .05; **P < .01; ***P < .001.
We next hypothesized that ASB2α might be an important regulator of adhesive structures such as podosomes in immature DCs. In adherent immature DCs generated from BM cells of control mice, podosomes can exist as individual puncta or as rosettes of podosomes (Figure 6E). As expected, the actin-rich core was surrounded by a region rich in vinculin in each discrete unit (Figure 6E). Furthermore, FLNa and vinculin were observed at individual podosomes (Figure 6E). Surprisingly, the percentage of cells with rosette podosomes was reduced in ASB2α−/− immature DCs (Figure 6C,E). This is in agreement with the fact that the percentage of cells with rosettes of podosomes is higher in FLNa-negative immature DCs than in FLNa-positive immature DCs derived from the BM cells of control mice (Figure 6D).
ASB2α−/− BMDCs exhibited reduced abilities to degrade the ECM and to migrate through matrigel-coated filters
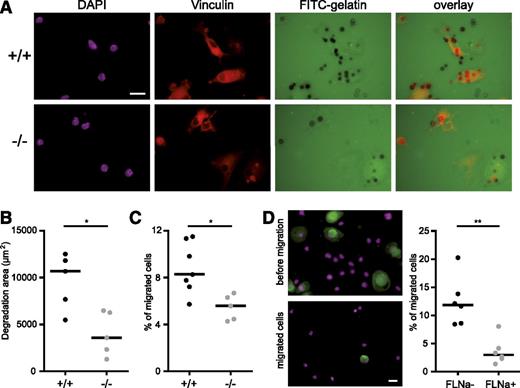
We next investigated the capacity of ASB2α−/− immature DCs to degrade ECM in order to migrate through a dense tissue-matrix. The immature DCs were seeded on glass coverslips coated with fluorescent gelatin and were incubated for 6 hours before fixation and staining with antibodies to vinculin. As shown in Figure 7A, holes in the gelatin were observed in the vicinity of vinculin-containing podosomes of ASB2α+/+ and ASB2α−/− immature DCs. However, ASB2α−/− immature DCs had a reduced ability to degrade the gelatin compared with ASB2α+/+ immature DCs (Figure 7A-B).
ASB2α regulates ECM degradation and migration through matrigel-coated filters. ASB2α−/− and ASB2α+/+ BMDCs were harvested and serum arrested for 1 hour in suspension. Cells were then plated on gelatin-coated coverslips and were fixed after 6 hours (A-B) or seeded onto matrigel-coated filters (C-D). (A) Images of ASB2α+/+ and ASB2α−/− BMDCs degrading FITC labeled gelatin coated on glass coverslips. Vinculin staining is shown in red and DAPI staining of the DNA in purple (B) Quantification of the area of FITC-labeled gelatin degraded by ASB2α+/+ and ASB2α−/− BMDCs. Dot plots show the overall distribution, and lines show the median values. (Sample size: +/+ = 5; −/− = 5). (C) Migration of ASB2α+/+ and ASB2α−/− BMDCs trough matrigel-coated transwells. The percentage of BMDCs that migrated to the bottom well is shown. (Sample size: +/+ = 7; −/− = 5). (D) Images of ASB2α+/+ BMDCs that were seeded onto matrigel-coated filters (before migration) or that were recovered at the bottom wells (migrated cells). Cells were centrifuged onto poly-l-lysine–coated glass coverslips, fixed, and stained for FLNa (green) and 4,6 diamidino-2-phenylindole (DAPI; purple). Dot plots show the percentages of migrated FLNa-negative (FLNa−) and FLNa-positive (FLNa+) BMDCs obtained from ASB2α+/+ mice. Scale bar represents 20 μm. (Sample size: 6). *P < .05; **P < .01.
ASB2α regulates ECM degradation and migration through matrigel-coated filters. ASB2α−/− and ASB2α+/+ BMDCs were harvested and serum arrested for 1 hour in suspension. Cells were then plated on gelatin-coated coverslips and were fixed after 6 hours (A-B) or seeded onto matrigel-coated filters (C-D). (A) Images of ASB2α+/+ and ASB2α−/− BMDCs degrading FITC labeled gelatin coated on glass coverslips. Vinculin staining is shown in red and DAPI staining of the DNA in purple (B) Quantification of the area of FITC-labeled gelatin degraded by ASB2α+/+ and ASB2α−/− BMDCs. Dot plots show the overall distribution, and lines show the median values. (Sample size: +/+ = 5; −/− = 5). (C) Migration of ASB2α+/+ and ASB2α−/− BMDCs trough matrigel-coated transwells. The percentage of BMDCs that migrated to the bottom well is shown. (Sample size: +/+ = 7; −/− = 5). (D) Images of ASB2α+/+ BMDCs that were seeded onto matrigel-coated filters (before migration) or that were recovered at the bottom wells (migrated cells). Cells were centrifuged onto poly-l-lysine–coated glass coverslips, fixed, and stained for FLNa (green) and 4,6 diamidino-2-phenylindole (DAPI; purple). Dot plots show the percentages of migrated FLNa-negative (FLNa−) and FLNa-positive (FLNa+) BMDCs obtained from ASB2α+/+ mice. Scale bar represents 20 μm. (Sample size: 6). *P < .05; **P < .01.
We then addressed whether the loss of ASB2α affects immature DC migration using a transwell migration assay coated with a dense layer of matrigel. Indeed, migration of ASB2α−/− immature DCs is reduced compared with that of ASB2α+/+ immature DCs (Figure 7C). Accordingly, migrated immature DCs from ASB2α+/+ mice were mainly FLNa negative (Figure 7D). Thus, ASB2α regulates ECM degradation and subsequent migration of immature DCs.
Discussion
In this study, we uncovered new regulators of DC function: FLNs and their regulator ASB2α. By combining cell biology and biochemical studies with the generation and characterization of a loss-of-function mouse model, we demonstrated that FLNs are substrates of the ASB2α cullin 5-ring E3 ubiquitin ligase in DCs. Furthermore, we demonstrated that loss of ASB2α increased cell spreading and inhibited podosome rosette formation, ECM degradation, and immature DC migration through matrigel-coated filters.
We report here that ASB2α is expressed in mouse immature BM- and spleen-derived DCs. This trend is consistent with the high expression of ASB2 transcripts in mouse classical DCs isolated from lymphoid (CD8-positive and CD8-negative DCs) or nonlymphoid (CD103-positive DCs) tissues that has been reported recently.31 Moreover, we showed that ASB2α is down-regulated after DC maturation. We further demonstrated that FLNa and FLNb are bona fide substrates of ASB2α E3 ubiquitin ligase activity in immature DCs and that ASB2α targets FLNa and FLNb to proteasomal degradation in immature DCs: (i) Decreased expression of FLNa and FLNb in immature DCs and increased expression in activated DCs are observed. (ii) ASB2α-induced FLNa degradation is dependent on ASB2α E3 ubiquitin ligase activity. (iii) FLNa and FLNb accumulation occur in ASB2α−/− immature DCs. Therefore, ASB2α should be added to the growing list of the E3 ubiquitin ligases involved in developmental regulation of DC functions.46-48
Although FLNs have been well studied in a variety of cell types and have been shown to play important roles in organizing cell shape and in regulating cell motility,7 no previous studies have pointed to FLNs as regulators of DC biology. Indeed, it is established that the nonlinear elasticity of the F-actin network can be attributed to the flexibility of the cross-linker FLNs.5,6 In addition, the architecture of this network is dependent on actin and FLN concentrations, suggesting that FLN levels must be coordinated in time and space for proper actin-based cell motility. Our results here demonstrate an original regulation of the stability of FLNs by the ASB2α E3 ubiquitin ligase in physiological relevant settings. Although FLNs seem to compensate for each other, it is worth noting that ASB2α induces degradation of all 3 FLNs.17 Therefore, our results are consistent with the fact that depletion of multiple FLNs in mouse embryonic fibroblasts showed defects in the spreading of the organelle-rich endoplasm.15 Altogether, our work provides a mechanism through which FLN levels are regulated by proteasomal degradation in immature DCs, allowing fine-tuning modulation of cell spreading.
Podosomes are highly dynamic adhesive structures that represent sites of attachment to the ECM and sites of degradation of the matrix, allowing immature DC migration through tissues.39,40 Indeed, podosomes auto-assemble into rings called rosettes, characterized by their own dynamics that reflect the synergistic behavior of the individual units.38,49 That the percentage of cells with rosette podosomes was reduced in ASB2α−/− immature DCs indicates that ASB2α normally enhances the formation of rosette podosomes and/or stability in immature DCs. Furthermore, our results point to ASB2α as a critical regulator of ECM degradation and immature DC migration through matrigel-coated filters. Consistent with this finding, FLNa and FLNb suppress matrix degradation and invasion in HT1080 fibrosarcoma cells.21 Conversely, in macrophages, FLNa stabilizes podosomes, thus enhancing matrix degradation,19 indicating that the effect of FLNs on podosome formation and matrix degradation is cell type specific. Altogether, our data support the idea that, in immature DCs, ASB2α acts as a positive regulator of ECM invasion through degradation of FLNs.
More knowledge of the molecular mechanisms involved in DC circulation is needed to find ways to improve therapeutic strategies involving immunotherapy. In this context, FLNs and ASB2α as regulators of cell motility in immature DCs may represent novel therapeutic targets. In addition, low expression levels of FLNa correlate with breast cancer progression and downregulation of FLNa stimulates cancer cell migration, invasion, and metastatic formation.20 Furthermore, it is worth noting that the FLNa/Refilin B complex controls the perinuclear actin network involved in nuclear shape reorganization during the epithelial-mesenchymal transition.50 In this context, future investigation dedicated to the modulation of FLNa levels may also be relevant for anticancer therapies.
The publication costs of this article were defrayed in part by page charge payment. Therefore, and solely to indicate this fact, this article is hereby marked “advertisement” in accordance with 18 USC section 1734.
Acknowledgments
The authors thank the Anexplo-IPBS and Toulouse Réseau Imagerie IPBS facilities, James Di Santo, and Olivier Bernard for the Mx1-Cre mice. The authors also thank Denis Hudrisier for helpful comments and suggestions.
This work was supported by the Centre National de la Recherche Scientifique and the University of Toulouse and by grants to P.G.L. from the Université Paul Sabatier and from the Agence Nationale de la Recherche. This work was also funded by grants from the European Research Council (A.-M.L.-D.; Strapacemi 243103) and the Biologie ces Cellules Dendritiques (DCBIOL) Labex from the French Government. The mouse mutant line was established at the Mouse Clinical Institute, Illkirch, France, and was funded in part by the Réseau National des Génopoles.
Authorship
Contribution: I.L., A.M., C.M.L., and P.G.L. designed research; I.L., A.M., E.G., M.L.H., and P.G.L. performed research; I.L., A.M., E.G., M.L.H., A.-M.L.-D., C.M.-L., and P.G.L. analyzed and interpreted the data; and I.L., A.-M.L.-D., and P.G.L. wrote the paper.
Conflict-of-interest disclosure: The authors declare no competing financial interests.
Correspondence: Pierre G. Lutz, Institut de Pharmacologie et de Biologie Structurale, UMR 5089 CNRS/UPS, BP64182, 205 Route de Narbonne, F-31077 Toulouse, France; e-mail: pierre.lutz@ipbs.fr.

This feature is available to Subscribers Only
Sign In or Create an Account Close Modal