Abstract
Anisocytosis is defined as excessive variation in the size of red cells. It can be quantified by measuring the red cell distribution width (RDW) and is routinely included in peripheral blood count reports. Anisocytosis has previously been associated with poorer prognosis in patients with coronary artery disease, congestive heart failure, pulmonary hypertension, pulmonary embolism, stroke, and sepsis, among other conditions. While anisocytosis is frequently present in patients with myelodysplastic syndromes (MDS), its prognostic significance is not well established. To address this, we conducted a survival analysis of patients with MDS evaluated at our clinical center.
To determine the association between anisocytosis and survival in patients with MDS, we conducted a retrospective cohort study. Patients with MDS evaluated at our institution between 1997 and 2011 were identified by searching medical records for ICD-9 diagnosis codes for MDS using the Clinical Looking Glass software. Patient records containing an MDS code were then examined for bone marrow biopsy results, and were included if consistent with MDS. Patient age, peripheral blood counts, cytogenetics findings, and bone marrow blast percentages at diagnosis, as well as the date of diagnosis, were abstracted from the medical record. Date of death was recorded from the medical record or by querying the Social Security Death Index. Anisocytosis was defined as an RDW ≥ 16.6%. Peripheral neutropenia was defined as an absolute neutrophil count < 800 cells/uL and a high bone marrow blast percentage as >5%. Low-risk cytogenetics was defined as either “Very Good” or “Good” by IPSS-R criteria; high-risk was either “Intermediate”, “Poor”, or “Very Poor.” We constructed Kaplan-Meier survival curves comparing those with anisocytosis to others. Survival was compared using the log-rank test. Next, we developed a Cox proportional hazards model to examine the association between anisocytosis and survival, after adjusting for age at diagnosis, hemoglobin concentration, platelet count, neutropenia, bone marrow blast percentage, and cytogenetics (values at diagnosis). Results are presented as the hazard ratio [HR] with 95% confidence interval [95% CI]. The study protocol was approved by the Montefiore Institutional Review Board.
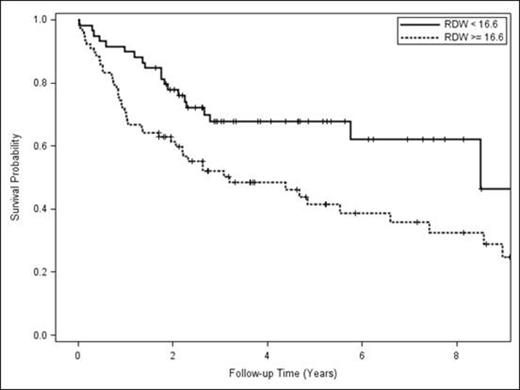
Of 543 patients initially identified, 30% (164/543) had bone marrow biopsies available. Of these, 84% (137/164) had cytogenetics data available. Anisocytosis at diagnosis was found in 57% (78/137). Median survival of patients with anisocytosis was 3.1 years compared to 8.5 years for those patients without anisocytosis (p = 0.02). In Cox regression analyses, anisocytosis was associated with worse prognosis (HR: 1.86 [95% CI: 1.06-3.35]). High-risk cytogenetics was significantly associated with decreased survival (HR: 3.47 [95% CI: 1.99- 5.94]). There was a trend toward a significant association between high bone marrow blast percentage and decreased survival (HR: 2.02 [95% CI: 0.96-4.01]). Age, hemoglobin concentration, platelet count, and presence of neutropenia were not significantly associated with survival.
In a single center retrospective chart review of patients with MDS, anisocytosis was associated with decreased survival when compared to patients with a normal or low RDW. This association remained in multivariable analysis adjusting for other well established prognostic variables. Our analysis was limited by a small sample size, potentially explaining the lack of significant associations found between survival and patient age, hemoglobin concentration, platelet count, and presence of neutropenia. However, it could also be possible that the effect of RDW supersedes the impact of peripheral cytopenias and even blast %, as reflected by the multivariate analysis. In conclusion, anisocytosis was significantly associated with patient prognosis and should be evaluated for for inclusion into future risk stratification systems.
| Variable | Hazard Ratio | 95% Confidence Interval |
| Anisocytosis | 1.86 | 1.05 – 3.30 |
| Age | 1.040 | 0.835 – 1.30 |
| Hemoglobin count | 0.96 | 0.87 – 1.072 |
| Platelet count | 0.92 | 0.79 – 1.081 |
| Neutropenia | 1.29 | 0.63 – 2.66 |
| High Risk Cytogenetics | 3.47 | 2.01 – 4.12 |
| Blasts > 5% | 2.03 | 1.00 – 4.12 |
Kaplan-Meier Curve, Survival in Elevated RDW vs. Normal/Low RDW
Kaplan-Meier Curve, Survival in Elevated RDW vs. Normal/Low RDW
No relevant conflicts of interest to declare.
Author notes
Asterisk with author names denotes non-ASH members.


This feature is available to Subscribers Only
Sign In or Create an Account Close Modal