Post-transplant erythrocytosis is an ominous complication of kidney transplantation, occurring in the first 8 to 24 months after surgery in 10% to 15% of transplant recipients; this is frequently associated with significant thromboembolic events and sometimes death. In patients undergoing allogeneic hematopoietic cell transplantation (HCT), erythrocytosis has not been previously well described. At our institution, we observed that some aplastic anemia (AA), and Fanconi anemia (FA) patients developed progressively increased hemoglobin (HB), hematocrit (HCT) and RBC readings on long term follow up. Thus, this study was conducted to assess the validity of this observation in AA/FA patients post HCT, and its impact on their health.
From January 1993 until December 2011, 144 pediatric patients underwent successful allogeneic HCT for AA or FA; median age at HCT 11.6 years (range, 6.6 -15). All patients included were alive at the time of the analysis, and had sustained engraftment; all have had a follow up time of ≥ 12 months. For those who underwent more than one HCT, only events after the last HCT were included. We retrospectively examined the HB levels as an indicator for erythrocytosis (Corresponding RBC, HCT, WBC, and platelet counts were also collected). HB values of 150, and 160 gm/l were considered the trigger value in females and males, respectively. Patients who reached this value were studied for higher values on follow up, and only those whose HB persisted for at least 3 months above trigger value were included in the analysis; 29 patients (15 females, 14 males) were identified after causes of secondary erythrocytosis were ruled out. Erythrocytosis was defined as HB ≥ 160 gm/l in females, a HB ≥ 170 gm/l in males.
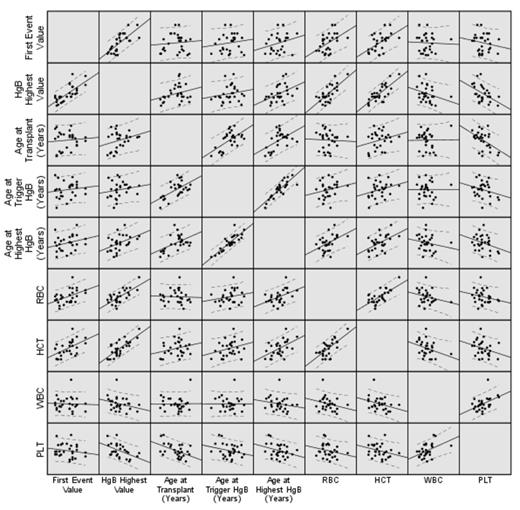
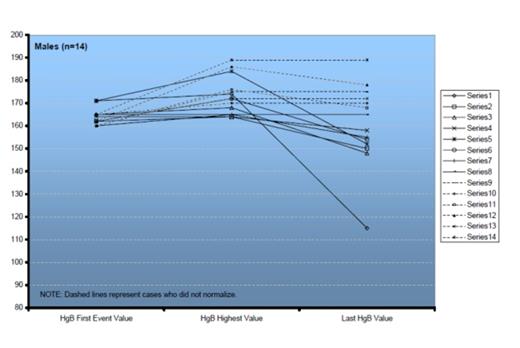
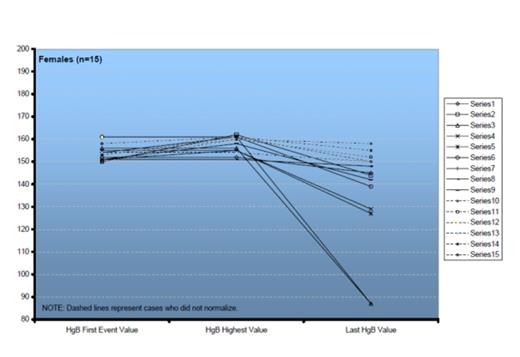
Median time to trigger HB was 51.4 months (range, 15-121) in females, and 65 months (range, 23.3-114) in males, and median age at trigger HB was 14.7 years (range, 8.6-21.4) in females, and 16.9 years (range, 13.4-20.6) in males. Median highest HB reached was 160 gm/l (range, 151-162) in females, and 172 gm/l (range, 164-189) in males, with a median time of 67 months (range, 17-164) in females, and 103 months (range, 23.3-206) in males; the median age at highest HB was 16 years (range, 9.7-24.8) in females, and 20.2 years (range, 13.4-27.4) in males. Upon follow up, the HB fell below the trigger level in 16 patients (9 females, 7 males) (55.2%), at a median time of 37.2 months from the trigger value (range, 3.6-104). Seventeen patients qualified for the diagnosis of erythrocytosis (12%); 8 females, and 9 males. In all 8 females and in 4 males, HB fell below the erythrocytosis value upon follow up. All HB values correlated positively with HCT and RBC, no correlation was detected with platelet count or WBC. On univariate analysis, patients with older age at HCT (≥ 10 years) appeared to be more likely to develop elevated HB (P=0.003); and those who had radiation in the conditioning regimen were less likely to develop elevated HB (P=0.008). Three of the males with persistent erythrocytosis were tested further and all 3 had normal erythropoietin levels and were negative for JAK-2 mutations. None of the 29 patients had any adverse clinical symptoms during the follow up visits, and no thromboembolic events were reported.
A proportion of patients with AA/FA who undergo HCT may experience elevated HB on long term follow up; 12% subsequently qualifying as erythrocytosis, with the highest reading requiring between 1.5-2 years to evolve. Unlike erythrocytosis post renal transplant, the phenomenon we are describing in our patient cohort does not appear to be associated with any adverse symptoms, or any increased risk of thrombosis. More in depth investigation to study the potential pathophysiology behind it is currently underway at our institution, together with further exploration of this observation in patients with other illnesses undergoing allogeneic HCT.
Correlation of HB with other variables
HB values from trigger point to last visit in male patients
HB values from trigger point to last visit in male patients
HB values from trigger point to last visit in female patients
HB values from trigger point to last visit in female patients
No relevant conflicts of interest to declare.


This feature is available to Subscribers Only
Sign In or Create an Account Close Modal