Abstract
The role of anthracyclines in the management of Grade 3 (G3) FL is unclear. Furthermore, the patterns of care and outcomes of first-line treatment strategies for G3 FL in older adults are not clearly established. We describe the patterns of use, determinants of treatment, and survival outcomes of first-line management strategies for G3 FL with emphasis on four common first-line regimens: cyclophosphamide, doxorubicin, vincristine, and prednisone (CHOP), rituximab (R) plus CHOP (R-CHOP), cyclophosphamide, vincristine, and prednisone (CVP), and R plus CVP (R-CVP).
We used the linked Surveillance, Epidemiology, and End Results -Medicare database to identify 1,308 G3 FL patients (pts) diagnosed between 1995 and 2009 and focused on pts diagnosed between 1999 and 2009 when claims with R appear. We ascertained first-line management strategies from Medicare claims made within 90 days of diagnosis. We used multiple variable logistic regression models to evaluate the relationship between pt characteristics and the use of first-line R-CHOP. We used Kaplan-Meier estimators stratified by FL stage to evaluate survival functions for first-line management strategies and performed multiple variable Cox proportional hazards regressions adjusted for pt demographics, comorbidity index, disease characteristics, and year of diagnosis to compare the impact of first-line management strategies on survival.
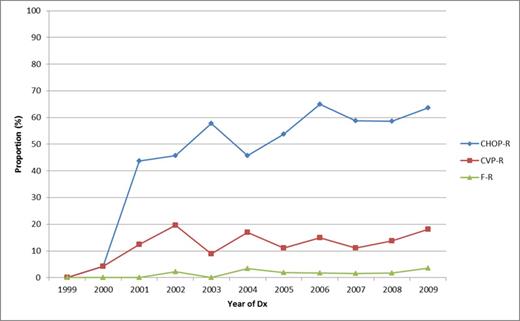
Of the 1,308 G3 FL pts, 59% were female, 91% were Caucasian, 3% were African American, 44% had stage III/IV disease, 6% had B-symptoms, and 36% had extranodal involvement. The median age at diagnosis was 75 (interquartile range 70-80). Common first-line management strategies were: observation (obs), 29%; R-CHOP, 26%; CHOP, 9%; radiotherapy alone (XRT), 8%; R alone, 8%; R-CVP, 7%; and CVP, 5%. The use of R-CVP and R-CHOP increased over time (Figure 1).
In the cohort of pts diagnosed between 1999 and 2009 the use of R-CHOP was less commonly associated with age >80 years (ref. age 66-70 years; OR 0.19; 95% CI 0.11-0.31), comorbidity index ≥ 2 (ref. index =0; OR 0.54; 95% CI 0.31-0.92), and more commonly associated with stage III/IV FL (OR 1.46; 95% CI 1.05-2.02), and year of diagnosis (ref. years 1999-2001; OR for 2002 3.68; 95% CI 1.77-7.64; steady increase thereafter).
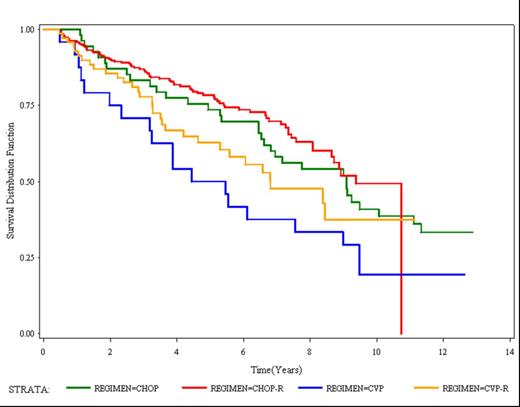
The table displays median survival and hazard ratios (HRs) for first-line management strategies. The most favorable outcomes were associated with first-line R-chemotherapy (R-Chemo). Among first-line R-chemo regimens, R-CHOP was associated with the most favorable outcomes (Figure 2).
Median survival and HRs for first-line management strategies in older adults with G3 FL
| . | All stages . | Stage I/II . | Stage III/IV . | |||
|---|---|---|---|---|---|---|
| . | Median OS (yrs) . | HR (95% CI) . | Median OS (yrs) . | HR (95% CI) . | Median OS (yrs) . | HR (95% CI) . |
| Obs | 6.76 | Reference | 6.92 | Reference | 6.18 | Reference |
| XRT | 6.36 | 1.09 (0.75-1.60) | 6.65 | 0.97 (0.62-1.53) | 1.22 | 1.99 (0.82-4.84) |
| Chemo | 6.81 | 1.03 (0.74-1.44) | 9.09 | 0.88 (0.54-1.42) | 5.54 | 1.23 (0.73-2.08) |
| R-Chemo | 8.91 | 0.60 (0.46-0.78) | Not reached | 0.63 (0.42-0.94) | 8.64 | 0.58 (0.39-0.87) |
| R alone | 5.86 | 1.01 (0.70-1.47) | 8.17 | 0.63 (0.32-1.22) | 4.33 | 1.32 (0.79-2.20) |
| All stages (n=655) | Stage I/II (n=332) | Stage III/IV (n=279) | ||||
| Obs | 6.76 | Reference | 6.92 | Reference | 6.18 | Reference |
| CVP | 4.95 | 1.47 (0.86-2.50) | 4.16 | 1.53 (0.75-1.35) | 5.46 | 1.20 (0.48-3.03) |
| CHOP | 9.08 | 0.76 (0.49-1.16) | 11.10 | 0.57 (0.30-1.08) | 6.45 | 0.96 (0.49-1.86) |
| R-CVP | 6.80 | 0.89 (0.59-1.35) | 6.57 | 1.09 (0.57-2.08) | 6.81 | 0.88 (0.48-1.62) |
| R-CHOP | 9.38 | 0.57 (0.42-0.77) | Not reached | 0.53 (0.33-0.85) | 8.91 | 0.52 (0.33-0.82) |
R-CHOP is the most commonly used first-line regimen in the United States for older adult pts with FL G3. Even after controlling for disease characteristics and comorbidity, R-CHOP was associated with the most favorable survival outcome.
No relevant conflicts of interest to declare.
Author notes
Asterisk with author names denotes non-ASH members.


This feature is available to Subscribers Only
Sign In or Create an Account Close Modal