Abstract

Magnetic resonance imaging (MRI) relaxometry, using either R2 or R2* measurements, has generally replaced liver biopsy for estimation of liver iron stores in response to iron chelation therapy, but there have been no longitudinal studies comparing R2 and R2* techniques. We used R2 and R2* liver iron concentration (LICR2 and LICR2*) estimates, transfusional iron burdens, and drug adherence data to calculate iron chelation efficiency in patients undergoing a phase 2 trial of SPD602 (formerly known as FBS0701), a tridentate iron chelator in development. We hypothesized that chelation efficiency estimates derived from LICR2 and LICR2* measurements would be in better agreement than baseline LIC assessments using the two techniques.
In the phase 2 clinical trial of SPD602, 51 patients underwent a baseline examination, 39 patients completed 48 weeks, and 26 patients completed 96 weeks. MRI assessment of liver R2 and R2* were performed at baseline, 12, 24, 48, 72, and 96 weeks, analyzed by experienced reference laboratories (Ferriscan R2 by Resonance Health Western Australia; R2* by Children's Hospital Los Angeles, CA), and converted to LIC using established calibrations. Efficiency was calculated according to the following equation:
where TII is the transfusional iron intake in mg/kg, ΔLIC is the change in LIC in mg/g dry weight, MWdrug and MWFe are the molecular weights of SPD602 and iron respectively, and drug is the total SPD602 consumed in mg/kg.
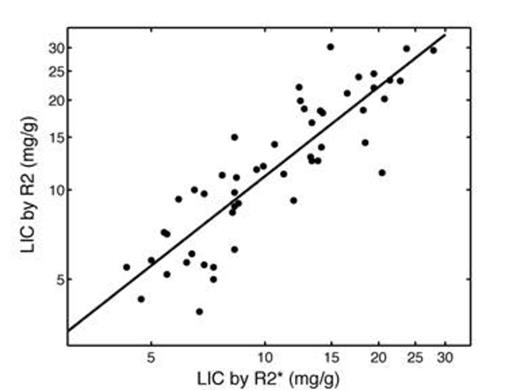
Figure 1 shows a scattergram of LICR2 versus LICR2* at baseline; both axes were log-transformed to normalize the variance. Resulting linear fit had a slope of 0.996, a scaling factor of 0.114 and an r2 of 0.76 (p< 0.0001). 95% limits of agreement were broad, measuring -53.8% to 53.8%.
However, chelation efficiency estimates across the two techniques compared more favorably, with r2 values 0.76 and 0.83 when calculated over 0–48 and 49–96 weeks, respectively. Figure 2 demonstrates the LICR2 and LICR2* chelation efficiency estimates in patients completing 96 weeks. The r2 value was 0.89 with excellent 95% limits of agreement [-3.5 to 3.5%]; elimination of two outliers improved the r2 value to 0.95.
Chelation efficiency from 0–96 weeks calculated by LICR2 and LICR2*, with best-fit line and 95% prediction intervals.
Chelation efficiency from 0–96 weeks calculated by LICR2 and LICR2*, with best-fit line and 95% prediction intervals.
Taken together, these data illustrate two important points for individual hematology practitioners. First, while R2 and R2* methods are individually as accurate as liver biopsy in predicting true LIC, large discrepancies between LICR2 and LICR2* can be observed for any given individual as shown by the baseline measurements. These discrepancies do not reflect intrinsic deficiencies of either technique, but arise because R2 and R2* are differentially sensitive to pattern and scale of iron deposition in the liver. Thus LICR2 and LICR2* cannot be used interchangeably in an individual.
Secondly, however, longitudinal assessments decrease systematic errors between and within techniques, just as paired statistics often provide greater statistical power than unpaired statistics. As a result, both LICR2 and LICR2* produce chelation efficiency estimates that are internally consistent and physiologically reasonable. The choice of MRI assessment technique for clinical trials and for clinical management depends on many logistical considerations, including cost, the expected dynamic range of iron burden, and the availability of trained, experienced personnel for image quality control and analysis. In summary, the present study demonstrates that well-performed LICR2 and LICR2* measurements yield comparable longitudinal monitoring of chelator effectiveness, suitable for clinical trials and for clinical practice.
Wood:Shire: Consultancy, Research Funding; Apopharma: Honoraria, Patents & Royalties; Novartis: Honoraria. Zhang:Shire: Employment. Rienhoff:Shire: Consultancy, Milestone Payments Other. Abi-Saab:Shire: Employment, Equity Ownership, Patents & Royalties; AbbVie: Equity Ownership, Patents & Royalties; Novartis: Equity Ownership, Patents & Royalties; Abbott: Equity Ownership, Patents & Royalties; Pfizer: Equity Ownership, Patents & Royalties. Neufeld:Shire: Consultancy.
Author notes
Asterisk with author names denotes non-ASH members.

This icon denotes a clinically relevant abstract


This feature is available to Subscribers Only
Sign In or Create an Account Close Modal