Abstract
Intra-tumoral heterogeneity (ITH) is increasingly viewed as the Achilles heel of treatment failure in malignant disease including multiple myeloma (MM). Most MM patients harbor focal lesions (FL) that are recognized on MRI long before bone destruction is detectable by conventional X-ray examination. Serial MRI examinations show that eventually 60% of patients will achieve resolution of FL (MRI-CR). However, this will lag behind the onset of a clinical CR by 18 to 24 months, thus attesting to the biological differences between FL and diffuse MM growth patterns. Consequently, we performed concurrent gene expression profiling (GEP) analyses of plasma cells (PC) from both random bone marrow (RBM) via iliac crest and FL. Our primary aims were to first compare the molecular profiles of FL vs. RBM, second to determine if ITH existed (as defined molecular subgroup and risk), and finally to investigate if the bone marrow micro-environment (ME) contained a biologically interesting signature.
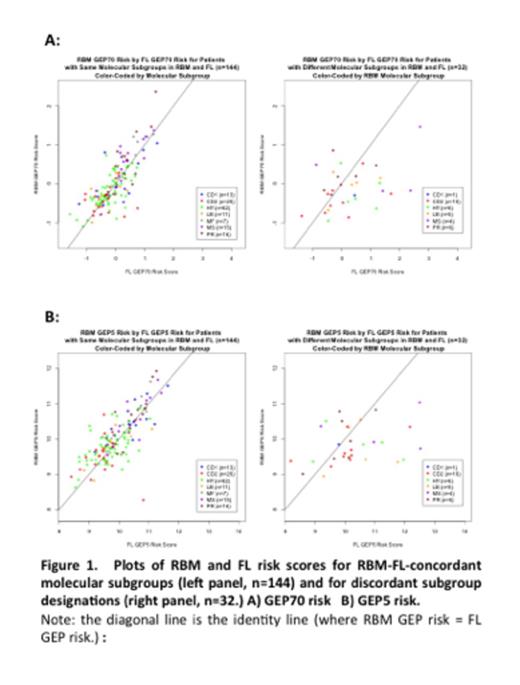
A total of 176 patients were available for this study with a breakdown of: TT3 (n=23), TT4 for low-risk (n=131) and TT5 for high-risk MM (n=22). Regarding the molecular analyses of PCs, GEP-based risk (GEP-70, GEP-5) and molecular subgroup correspondence were examined for commonalties and differences between RBM and FL. A “filtering” approach for ME genes was also developed and bone marrow biopsy (BMBx) GEP data derived from this method is under analysis.
Cox regression analysis of variables linked to overall and progression-free survival in TT4.
| . | Overall Survival . | Progression-Free Survival . | ||||
|---|---|---|---|---|---|---|
| . | Variable . | n/N (%) . | HR (95% CI) . | P-value . | HR (95% CI) . | P-value . |
| Multivariate | B2M > 5.5 mg/L | 38/130 (29%) | 3.71 (1.49, 9.22) | 0.005 | 3.84 (1.58, 9.31) | 0.003 |
| FL GEP5 High Risk | 14/130 (11%) | 3.68 (1.19, 11.41) | 0.024 | 3.73 (1.20, 11.62) | 0.023 | |
HR- Hazard Ratio, 95% CI- 95% Confidence Interval, P-value from Wald Chi-Square Test in Cox Regression
NS2- Multivariate results not statistically significant at 0.05 level. All univariate p-values reported regardless of significance.
Multivariate model uses stepwise selection with entry level 0.1 and variable remains if meets the 0.05 level.
A multivariate p-value greater than 0.05 indicates variable forced into model with significant variables chosen using stepwise selection.
No relevant conflicts of interest to declare.
Author notes
Asterisk with author names denotes non-ASH members.


This feature is available to Subscribers Only
Sign In or Create an Account Close Modal