Abstract
DLBCL is the most commonly occurring form of non-Hodgkin lymphoma and is a highly curable disease, but one that is universally fatal if untreated or improperly treated. In a series of studies, we have reported racial disparities in the clinical presentation and outcomes for patients (pts) with DLBCL in the United States (Shenoy, Cancer2010; Flowers, CEBP 2012). These studies showed that black pts with DLBCL are diagnosed at an age a decade younger than whites, are more likely to have advanced stage disease, and are less likely to survive 5 years. Standard prognostic models for DLBCL patients do not consider these racial disparities, and the International Prognostic Index (IPI) did not predict survival in a DLBCL cohort enriched for African American pts (Flowers, Leuk Lymph 2012). To examine whether specific prognostic models can improve the prediction of survival for black pts in the US, we utilized Surveillance, Epidemiology, and End Results (SEER) data and compared general logistic regression (LR) and race-specific LR models based on the age-distribution for DLBCL in black pts.
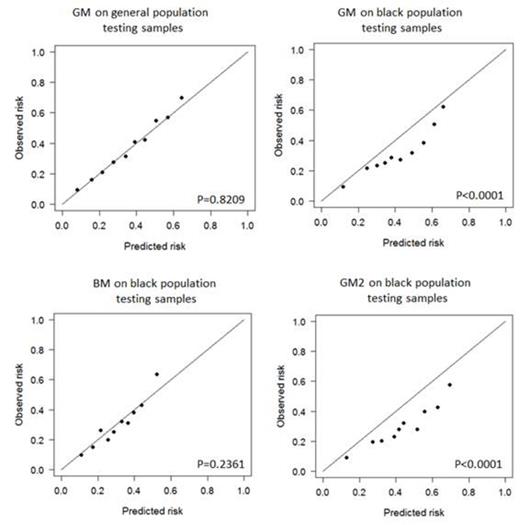
Demographic and survival SEER data from 1992 to 2009, for white and black DLBCL pts were selected. Model inputs include age category, gender, stage, and presence of B-symptoms. LR was used to predict 5-year overall survival (OS). First, in the general model (GM), 13,000 (30%) of total general population were sampled as training set where race ratio (white:black≈12:1) was maintained, and 1450 individuals of the general population and 1450 individuals of the black population were sampled as different testing sets. The GM performance on the two different testing sets was compared. Second, we compared the performance of GM2 and black model (BM) on the same testing sets. GM2 was trained on 1450 individuals sampled from general population, BM was trained on 1450 (60%) individuals sampled from black population, and both models were tested on 1000 (40%) sampled individuals from black population. Age categories in GM were defined based on quartiles of age distribution for general SEER DLBCL population. Age categories in BM were defined based on quartiles of age distribution for black population. Model calibration was measured by Hosmer-Lemshow (H-L) goodness-of-fit test as primary endpoint, and receiver operating characteristics (ROC) analysis for discrimination as a secondary endpoint. Sampled testing sets were always distinct from the training sets. We utilized bootstrap methods to repeat sampling and comparisons 1,000 times, and obtained the average performance for each experiment.
From 1992 to 2009, 30,646 white and 2,450 black patients of DLBCL in SEER were selected. As expected GM, GM2, and BM were well-calibrated with respect to each training set. As shown in the table, GM remained well calibrated on general population testing samples (H-L test p=0.30), but not on black population testing samples (p<0.0001). When tested on the same black population testing samples, GM2 did not fit (p<0.0001) while BM showed a good fitting to testing set (p=0.17; Figure). ROC analyses area-under-curve (AUC) of GM on the two testing sets were also different, although the difference between AUC of GM2 and BM was not significant. Influential factors in the LR model trained using all black population data include age ≥67 (third quartile) with odds ratio (OR) 0.284 (95% CI: 0.215-0.374), I/II stage with OR 0.505 (0.407-0.626), and presence of B-symptoms with OR 0.627 (0.496-0.793).
Model performance.
| Model . | Average Training p-value of H-L test . | Testing samples . | Average p-value of H-L test . | AUC (stdev) . |
|---|---|---|---|---|
| GM (n=13,000) | 0.1906 | General population (n=1450) | 0.2990 | 0.714(0.01) |
| Black population (n=1450) | <0.0001 | 0.677(0.01) | ||
| GM2 (n=1450) | 0.4988 | Black population (n=1000) | <0.0001 | 0.672 (0.01) |
| BM (n=1450) | 0.3021 | 0.1656 | 0.665 (0.01) |
Population-based survival prediction models of DBLCL developed for the general population are not calibrated well and do not predict OS accurately for black pts. Given differences in baseline characteristics, specific risk model trained on black pts can improve risk prediction in the black population. Future studies should explore additional modification that include identified biological differences in DLBCL subtype by race (Flowers, ASH 2012) to further improve survival prediction for populations of black pts with DLBCL.
No relevant conflicts of interest to declare.
Author notes
Asterisk with author names denotes non-ASH members.


This feature is available to Subscribers Only
Sign In or Create an Account Close Modal