

Abstract
Cancer emerges as a consequence of multiple genetic aberrations that ultimately cause global changes in gene expression driving the malignant phenotype. Hence, identification of aberrantly expressed genes in cancer cells, as compared to their corresponding normal cells, provides information on the biology of the cancer as well as potential targets for therapeutic interventions. Here, we report an access-free internet platform for visualization of mRNA expression profiles in acute myeloid leukemia (AML) patient samples as compared to normal bone marrow (BM) populations representing successive stages of differentiation along the myeloid differentiation pathway. The internet platform allows for quick visualization of user selected genes in AML patients in either human or murine hematopoietic stem cells (HSC), myeloid hematopoietic progenitor cells (HPC) and their progeny, as well as mature cells of innate and adaptive immune system. Significantly, users can upload own microarray data to compare gene expression in their samples of interest to those available at the internet platform. Overall, our internet platform represents a powerful tool for studies of normal hematopoietic development as well as aberrantly expressed genes in AML and potentially other hematological malignancies.
The web tool will be made available at http://servers.binf.ku.dk/hemaexplorer/
Raw Affymetrix microarray data from our own repository and public available databases were normalized and batch corrected to build an integrated gene expression database for a series of normal hematopoietic cells and AML patient samples, at progressing stages of differentiation, which can be visualized directly or compared to external samples added by the user. A complete database of internal and user-supplied samples is build at each run of the analysis, using uniform transformation and correction parameters adjusted to ensure full integrity and comparability across all samples.
The microarray database includes 44 highly purified sorted human normal blood samples and BM populations including HSCs, myeloid HPCs and their progeny, as well as mature cells of the innate and adaptive immune system. 10 samples were from public sources. In addition, our database includes microarray data from multiple AML studies (> 1000 samples across platforms) allowing for comparison of gene expression in WHO defined AML subclasses and normal hematopoietic cells.
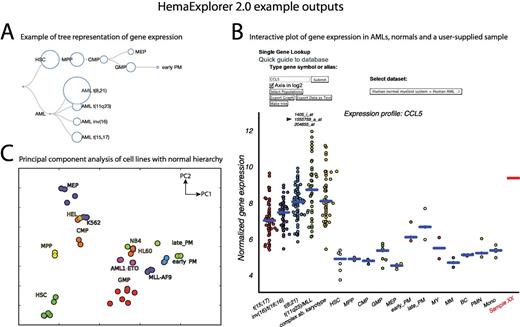
The main strength of the data-driven HemaExplorer 2.0 tool is the ability to quickly assess the main trends in how an AML sample diverges from normal cells during normal myeloid development. This can be accessed by specifying a gene of interest (Figure panel A-B. A user-supplied sample is marked in red in panel B) which provides interactive plots and hierarchical visualisations of gene expression where parameters including gene of interest, data source, and cell types can be selected and presented directly on the output figures usable for publications. Furthermore, a principal component analysis (PCA) plot can be performed, which allows for an unsupervised gene expression based mapping of user provided samples to the most closely related normal cell populations (figure panel C - here shown with cell lines commonly used in AML research).
Several websites offer visualisation of gene expression in cells from the hematopoietic system, including Gene Expression Atlas (Nucl. Acids Res., 40, D1077–D1081) and our own HemaExplorer (Blood, 119(26), 6394-5 and Nucl. Acids Res. 41, D1034-D1039), without the possibility of external sample addition provided by the users. Gene Expression Commons (PLoS ONE 7(7), e40321) provides this option for public data, based on a common expression model. Here we offer the ability to add and compare unpublished microarray gene expression profiles to various types of normal blood and BM populations, in a ready-to-use platform normalized on single sample level, independently on the overall distribution of expression in a selected set of reference samples. Future efforts will include the ability to provide a standard differential expression analysis, comparing the user-supplied sample with a selection of the normal hematopoietic hierarchy. Furthermore, we aim to be able to offer a standalone version of the tool, which can be implemented internally on hospital servers, and expand the list of accepted microarray platforms.
No relevant conflicts of interest to declare.

This feature is available to Subscribers Only
Sign In or Create an Account Close Modal