Abstract
Exploring spatial patterns of disease incidence allows for the identification of areas of elevated or decreased risk. For chronic lymphocytic leukemia and small lymphocytic leukemia (CLL/SLL), which have poorly understood etiologies, identifying spatial patterns through cluster analysis may provide insight about potential environmental and socio-demographic risk factors.
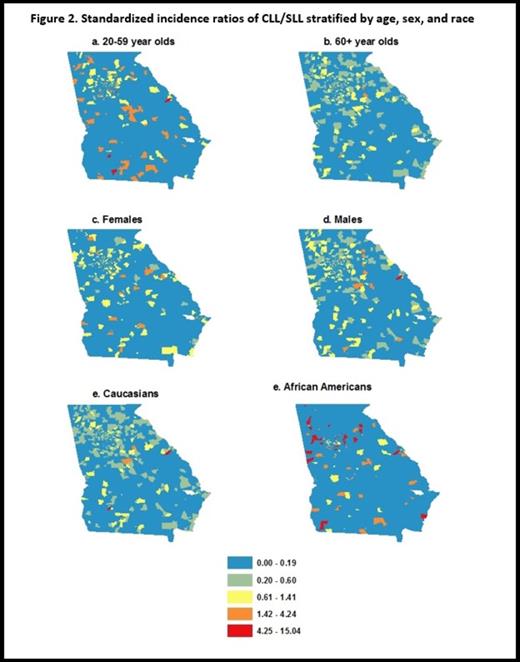
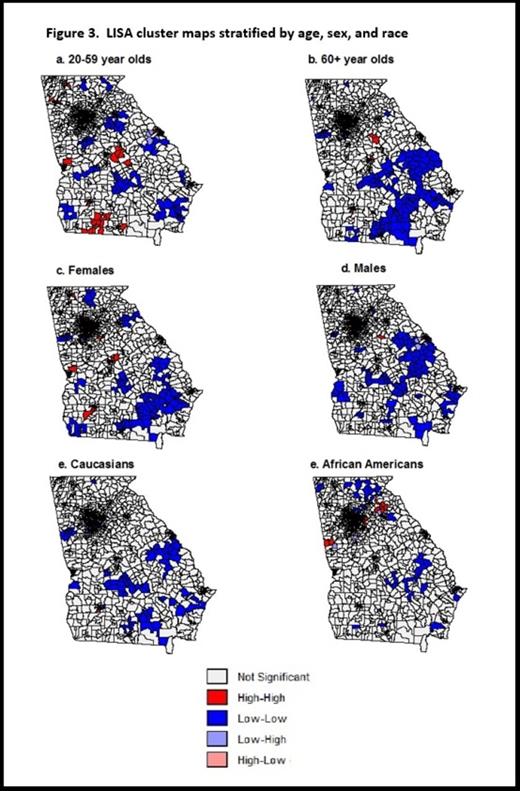
In order to investigate the spatial patterns of CLL/SLL incidence among adults (≥ 20 years), we linked cancer incidence data for the period 1999-2008 from the Georgia Comprehensive Cancer Registry (a CDC-supported a statewide population-based cancer registry collecting all cancer cases diagnosed among Georgia residents since 1995) with population data from the 2000 U.S. Census. CLL/SLL cases were aggregated to the census tract level. CLL/SLL incidence in Georgia was standardized indirectly by age, sex, and race to national rates obtained from SEER*Stat software. Choropleth maps were created to depict the ratio of observed to expected incidence (standardized incidence ratios [SIR]) by census tract using ArcGIS. Spatial Empirical Bayes smoothing was performed on the SIR values using GeoDa 1.01. To assess spatial correlation of SIRs, we conducted global and local cluster analyses by calculating global Moran’s I and local Moran’s I (also known as Local Indicators of Spatial Autocorrelation [LISA]) values. Cluster analyses were repeated, stratifying by age (20-59 years, 60+ years), sex, and race (Caucasian and African American). P-values less than 0.01 were considered statistically significant.
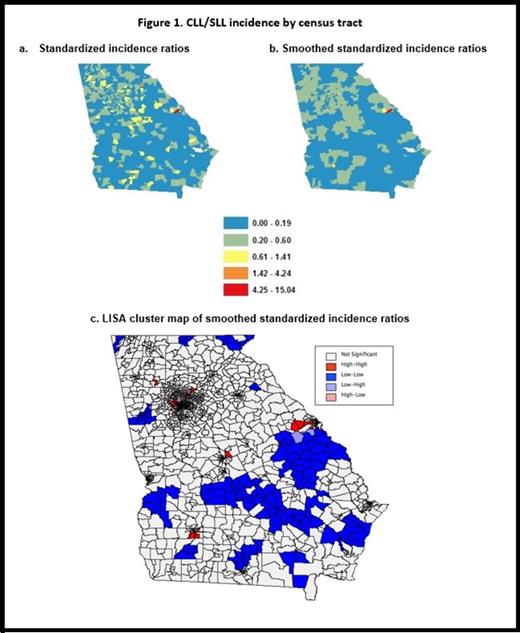
765 incident CLL/SLL cases occurred among adults residing in Georgia between 1999 and 2008 (Table 1). There was a positive spatial autocorrelation for cases of CLL/SLL age 60 and older indicating these cases were geographically clustered (p = 0.0010) (Table 2). The LISA cluster map of the smoothed standardized incidence ratios shows the locations of “hot-spots” (high-high clusters) and “cold-spots” (low-low clusters) with clustering of high smoothed SIRs was found in the metro-Atlanta area, Albany, Macon, and outside of Augusta while cold-spots were mostly in the southern region of the state.
Study population demographics
| . | CLL/SLL Cases (N=765) . | GA population (N=5,582,707)* . | ||
|---|---|---|---|---|
| Characteristic . | N . | % . | N . | % . |
| Age Group | ||||
| 20-59 years | 246 | 32.2 | 4,521,891 | 81.0 |
| 60 years | 519 | 67.8 | 1,060,816 | 19.0 |
| Female | 311 | 40.7 | 2,907,559 | 52.1 |
| Male | 454 | 59.3 | 2,675,148 | 47.9 |
| White | 583 | 76.3 | 3,922,068 | 70.3 |
| Black | 179 | 23.4 | 1,521,316 | 27.3 |
| American Indian/Alaskan Native | 1 | 0.1 | 15,326 | 0.3 |
| Asian or Pacific Islander | 2 | 0.3 | 123,997 | 2.2 |
Based on 1,616 census tracts in GA from the 2000 U.S. Census
Global measures of spatial autocorrelation
| Group . | Moran’s I . | p-value . |
|---|---|---|
| All cases | 0.0273 | 0.0320 |
| 20-59 years old | 0.0156 | 0.1270 |
| 60 + years old | 0.0510 | *0.0010 |
| Females | 0.0280 | 0.0410 |
| Males | -0.0039 | 0.4310 |
| Caucasians | -0.0046 | 0.1110 |
| African Americans | -0.0007 | 0.3990 |
| Group . | Moran’s I . | p-value . |
|---|---|---|
| All cases | 0.0273 | 0.0320 |
| 20-59 years old | 0.0156 | 0.1270 |
| 60 + years old | 0.0510 | *0.0010 |
| Females | 0.0280 | 0.0410 |
| Males | -0.0039 | 0.4310 |
| Caucasians | -0.0046 | 0.1110 |
| African Americans | -0.0007 | 0.3990 |
Significant at α = 0.01
Despite the low number of cases of CLL/SLL in Georgia during the 10-year period studied, we found evidence of spatial clustering among adults 60 years and above. Hot-spots of smoothed SIRs were located in the metro-Atlanta area, Albany, Macon, and near Augusta, but these varied when stratified by age, sex, and race, suggesting confounding or effect modification that warrants further investigation.
Flowers:Spectrum: Research Funding; Celgene: Consultancy, Research Funding; Millennium/Takeda: Consultancy, Research Funding; Genentech BioOncology: Consultancy; Sanofi: Research Funding; Janssen: Research Funding; Abbott: Research Funding.
Author notes
Asterisk with author names denotes non-ASH members.


This feature is available to Subscribers Only
Sign In or Create an Account Close Modal