Abstract
The lymphoma proteome is the phenotypic representation of the underlying genetic and epigenetic makeup of each individual patient's tumor. The proteome is rich in druggable targets and offers a unique opportunity for the hematologist to personalize therapy. We developed a deep proteomic profiling method using ion exchange fractionation and tandem mass spectrometry. In this pilot study, we applied this method to detect differentially expressed proteins in anaplastic large cell lymphoma (ALCL) cell lines with previously known (ALK-positive) and unknown (ALK-negative) therapeutic targets. We then asked whether integrative informatic analysis of these data could be used to predict drug sensitivity in each of the cell lines.
To examine reproducibility of our method, proteins were extracted independently from 4 pellets each of FE-PD (ALK-negative) and Karpas 299 (ALK-positive) ALCL cells, reduced with dithiothreitol, alkylated with iodoacetamide, and digested with trypsin. Resulting peptides were separated into 6 fractions using strong anion exchange (SAX) chromatography. Peptides in each fraction were analyzed via shotgun proteomics on a QExactive mass spectrometer. Peptide mass spectra (MS/MS) were matched against a RefSeq human protein sequence database using MyriMatch software. Reversed sequences were added to the database to measure identification false discovery rates (FDRs). IDPicker filtered the peptide identifications at 2% FDR. Proteins with at least two unique peptide identifications and five MS/MS matches were considered to be present in the sample. Filtered protein identifications and corresponding spectral counts were used as input to QuasiTel software, which was configured to use proteins with at least one spectrum per biological replicate. Proteins that were significantly differentially expressed (quasi p-value < 0.05) with an absolute log2 fold-change of at least 0.5 fold were loaded into the Ingenuity Pathway Analysis (IPA) software, and a master list of drugs and corresponding gene targets was assembled using PharmGKB database and the Drug-Gene Interaction Database (DGID). The resulting drug-gene target list was merged with the differentially expressed protein identifications. Candidate targets were validated by Western blot and candidate drugs were assessed in viability assays.
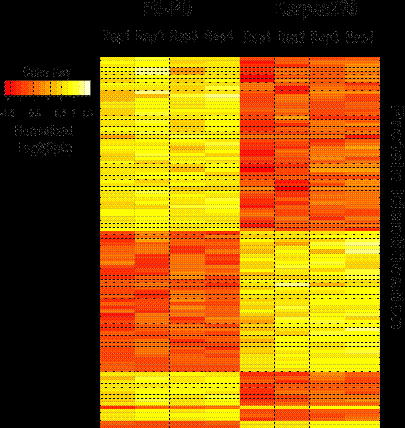
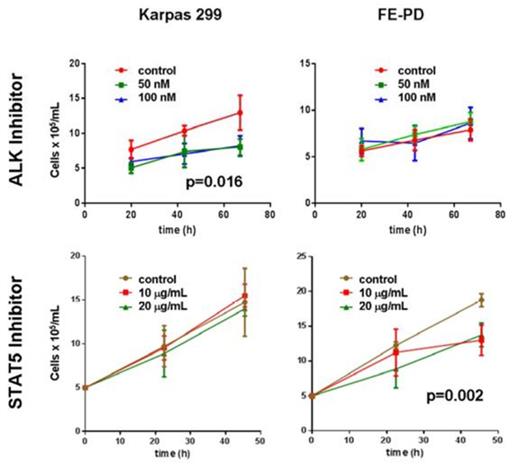
The SAX-LC-MS/MS method identified 10,111 proteins from all replicate analyses of FE-PD and Karpas 299 samples, and 93% of the identified proteome was detected in all 4 replicate analyses. The detected proteome was well represented by key transcription factors, phophatases, kinases, translation regulators and transmembrane regulators. There were 1369 proteins differentially expressed between the 2 cell lines, 709 up regulated in Karpas 299 cell line and 673 up regulated in FE-PD. Differentially expressed proteins also showed consistent expression across the biological replicates (Figure 1). Our integrated approach to identify candidate targets and drugs “rediscovered” ALK in Karpas299 and unexpectedly identified relative overexpression of the IL2-IL2RA-STAT5A-STAT5B network in ALK-negative FE-PD cells. Western blot confirmed these findings. As expected, 50-100 nM crizotinib (ALK inhibitor) decreased Karpas 299 viability (p =0.016) but had no effect on FE-PD (Figure 2). In contrast, 50-100 nM of the experimental STAT5 inhibitor 573108 (EMD Millipore) decreased FE-PD viability (p=0.002) but had no effect on Karpas 299 (Figure 2).
Cell survival assays of FE-PD and Karpas 299 with crizotinib and an experimental Stat5 inhibitor demonstrated differential sensitivity of the cell lines to drugs.
Cell survival assays of FE-PD and Karpas 299 with crizotinib and an experimental Stat5 inhibitor demonstrated differential sensitivity of the cell lines to drugs.
The lymphoma proteome is complex with 10,000 proteins and contains druggable targets that can be reproducibly identified using SAX-LC-MS/MS. These targets vary across samples and integrated informatic analysis can predict target-drug combinations that have efficacy in an experimental model. These data suggest that SAX-LC-MS/MS could be used to personalize treatment regimens in lymphoma patients. Figure 1: Spectral counts of 1369 differentially expressed proteins between Karpas299 and FE-PD cell lines were normalized and plotted in a heat map. Red color indicates down regulation and yellow color indicates up regulation.
No relevant conflicts of interest to declare.
Author notes
Asterisk with author names denotes non-ASH members.


This feature is available to Subscribers Only
Sign In or Create an Account Close Modal