Abstract
The International Prognostic Scoring System (IPSS) has been the most widely used risk assessment tool to predict clinical outcome in MDS. Recently, the revised IPSS (IPSS-R) was introduced to allow a greater discriminating capacity in assessing cytogenetic abnormalities and cytopenias and further refines prognostication. However, like the IPSS, the IPSS-R was developed in pts with primary MDS and its utility in pts with secondary (s)MDS is unclear.
We conducted an IRB-approved analysis of 765 pts diagnosed with MDS (per 2008 WHO criteria) and evaluated at the Cleveland Clinic between 9/1998 and 1/2013. IPSS-R was calculated as described previously (Greenberg et al, Blood 2012). Cytogenetic risk subgroups were per IPSS-R. Overall survival (OS) was measured from the time of diagnosis to time of death or last follow up. Time-to-event analyses were performed by the Kaplan-Meier method, and curves were compared with the 2-tailed log rank test. Differences among variables were evaluated by the chi-square test and Mann-Whitney U test for categorical and continuous variables, respectively.
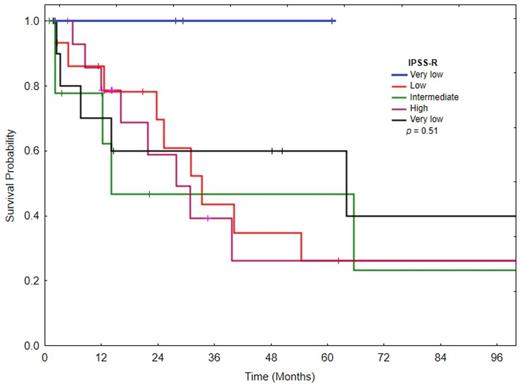
We identified 56 pts (7%) with sMDS: 14 (25%) pts had prior antecedent hematologic disorder, 32 (57%) had prior radiation therapy, and 10 (18%) received prior chemotherapies. Eleven pts (20%) were untreated and 45 pts (80%) received treatment: 17 (30%) with single agent 5-azacitidine, 12 (21%) with supportive measures, 9 (16%) with hematopoietic stem cell transplant (HSCT), and 7 (11%) with other therapies. For all pts, the median age was 66 years (range, 24-81). Median white blood cell count at diagnosis was 3.8 k/mL (range, 0.9-179.7), median absolute neutrophil count (ANC) was 2.2 k/mL (range, 0.1-145.6), median hemoglobin was 9.6 g/dL (range, 0.4-14), median platelet count was 65 X 103/mL (range, 4-460), and median bone marrow blasts was 5% (range, 0-26). The distribution of cytogenetic categories based on IPSS-R criteria was similar in pts with sMDS [2 (4%) very good, 28 (50%) good, 8 (14%) intermediate, 10 (18%) poor and 8 (14%) very poor] compared to primary MDS [28 (4%) very good, 351 (50%) good, 109 (15%) intermediate, 84 (12%) poor and 137 (19%) very poor]. IPSS-R risk categories in pts with sMDS [3 (5%) very low, 15 (27%) low, 11 (20%) intermediate, 15 (27%) high, and 12 (21%) very high] compared to primary MDS [75 (11%) very low (P = 0.15), 221 (31%) low (P = 0.3), 162 (23%) intermediate (P = 0.3), 145 (20%) high (P = 0.1), and 106 (15%) very high (P = 0.1)] were also similar. With a median follow up of 18.4 months (m, range, 1.8-104.6), the median OS for sMDS pts was not reached for very low risk pts, 31.6 m for low risk, 13.7 m for intermediate risk, 27.3 m for poor risk and 39 m for very poor risk (P = 0.15, Figure 1).
Although pts with sMDS had similar cytogenetic and IPSS-R risk categories compared to those with primary MDS, the IPSS-R did not predict for OS in sMDS pts. The lack of predictability of IPSS-R could be because that most of our pts with sMDS received therapy including HSCT. A new prognostic module to predict the outcome of pts with sMDS who are receiving treatment is needed.
No relevant conflicts of interest to declare.
Author notes
Asterisk with author names denotes non-ASH members.


This feature is available to Subscribers Only
Sign In or Create an Account Close Modal