Abstract
Clinical course and outcomes of MAA are variable. Unlike severe AA (SAA), few studies addressing treatment of MAA have been conducted, leading to a less conclusive clinical practice guidelines. In the present study, we evaluated IST efficacy in patients with newly diagnosed and chronic MAA.
MAA was defined as hypocellular bone marrow and at least bi-lineage cytopenia without meeting the criteria for SAA. Criteria of chronic MAA were documented cytopenia lasting more than 3 months and absence of progression to the SAA. All other cases were classified as newly diagnosed MAA. This study included both retrospective and prospective phases. The hematological response was evaluated according to the strict criteria (Camitta B., 2000). Adult patients or parents of children signed informed consent.
A total of 88 patients (median age 26 years, 6-71) were included between 1994 and 2013. Newly diagnosed and chronic MAA were in 50 (57%) and 38 (43%) patients respectively (Table I). There is a female preponderance in chronic MAA (68%). No statistically significant differences in baseline blood counts except Hb and PLT levels were found between two groups. The PNH clones and HLA-DRB1*15 were detected in both groups, with a trend towards increasing frequency in newly diagnosed MAA. The median time between diagnosis and IST was 5 times longer in chronic MAA.
Patient and disease characteristics
| . | Newly diagnosed MAA . | Chronic MAA . | P . |
|---|---|---|---|
| Age, years, median (range) | 23 (6-65) | 29 (8-71) | 0.554 |
| Gender, female, n (%) | 22 (44%) | 26 (68%) | 0.0308 |
| Baseline blood counts, median, (range) | |||
| Hb, g/l | 64 (27-107) | 73 (45-129) | 0.019 |
| ARC, × 109/l | 26 (2-151) | 43 (7-185) | 0.109 |
| MCV, fl | 97 (80-112) | 101 (77-114) | 0.286 |
| PLT, × 109/l | 15 (2-106) | 27 (5-100) | 0.0001 |
| WBC, × 109/l | 2.7 (1.1-4.17) | 2.45 (1.3-4.0) | 0.861 |
| ANC, × 109/l | 0.819 (0.522-1.440) | 0.799 (0.500-1.815) | 0.666 |
| ALC, × 109/l | 1.617 (0.450-3.240) | 1.315 (0.399-3.200) | 0.123 |
| PNH positive, n/n (%) | 28/46 (61%) | 15/33 (45%) | 0.252 |
| HLA-DRB1*15 positive, n/n (%) | 15/27 (56%) | 5/13 (38%) | 0.501 |
| Interval between diagnosis and IST, days, median (range) | 29 (0-131) | 159 (0-4673) | 0.0001 |
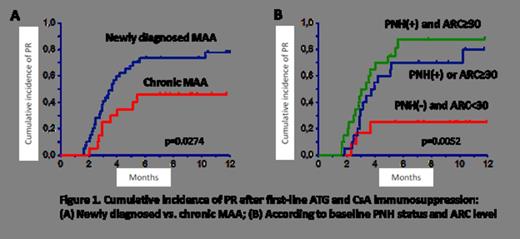
A total of 54 patients (61%) responded to the first line IST including 31/41 (76%) and 23/47 (49%) patients after ATG+CsA combined IST and CsA alone respectively (p=0.015). In addition, another 15 patients achieved remission after the second and third line of combined IST, which provided a total response rate of 78%. In multivariate logistic regression analysis of combined IST, newly diagnosed vs. chronic MAA (Odds ratio (OR) 6.61, 95% CI, 1.25-35.0, p=0.026) and baseline PNH positivity plus absolute reticulocyte count (ARC) ≥ 30 × 109/l (OR 16.71, 95% CI, 2.13-130.91, g=0.007) predicted better response rate (Fig.1). Conversely, preceding treatment with CsA alone had borderline statistically significant negative impact (OR 0.218, 95% CI, 0.045-1.06, p=0.059).
Relapse occurred in 11 (16 %) of responders with an apparent higher 10- year cumulative incidence in chronic vs. newly diagnosed MAA (62% vs. 12%, p=0.003). Eight patients developed MDS/AML with the similar 12-year cumulative incidence in both groups (30% vs. 31%, p=1.0).
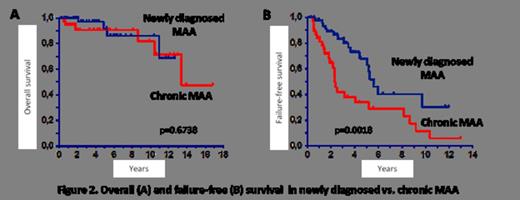
Late events also included rectal cancer (n=1) and hemolytic PNH (n=6). Ten patients died due to cytopenia complications (n=3), MDS and allogeneic SCT complications (n=5), AML (n=1) and rectal cancer (n=1). With a median follow-up of 45 months (range, 4-202), the probability of 5- and 10- year overall survival were 92% (95% CI, 84-99) and 83% (95% CI, 70-97) respectively, with no statistically significant difference between newly diagnosed and chronic MAA (Fig. 2A). Due to rather high rates of nonresponse, relapses and late events the failure-free survival (FFS) was much lower: 51% (95% CI, 38-64) and 20% (95% CI, 6-35) at 5 and 10 years respectively, with significant differences between newly diagnosed (63% and 30%) and chronic MAA (34% and 12%) (p=0.002) (Fig. 2B).
These data demonstrate that despite encouraging short-term results the long-term prognosis of MAA after IST is rather poor. Preceding chronic course of MAA and associated watch and wait practice or non-intensive treatment have negative impact on the response rates and FFS after combined IST. Further controlled studies of early intensive treatment and the search for biological predictors of long-term outcomes are warranted to determine the optimal treatment strategy in MAA.
No relevant conflicts of interest to declare.
Author notes
Asterisk with author names denotes non-ASH members.


This feature is available to Subscribers Only
Sign In or Create an Account Close Modal