

Abstract
Platelets release numerous bioactive molecules stored in their granules enabling them to exert a wide range of effects on the vascular microenvironment. Are these granule cargo released thematically in a context-specific pattern or via a stochastic, kinetically controlled process? Here we sought to describe the platelet exocytosis using a systematic examination of platelet secretion kinetics. Platelets were stimulated for increasing times with different agonists (ie, thrombin, PAR1-agonist, PAR4-agonist, and convulxin) and micro-ELISA arrays were used to quantify the release of 28 distinct α-granule cargo molecules. Agonist potency directly correlated with the speed and extent of release. PAR4-agonist induced slower release of fewer molecules, whereas thrombin rapidly induced the greatest release. Cargo with opposing actions (eg, proangiogenic and antiangiogenic) had similar release profiles, suggesting limited thematic response to specific agonists. From the release time-course data, rate constants were calculated and used to probe for underlying patterns. Probability density function and operator variance analyses were consistent with 3 classes of release events, differing in their rates. The distribution of cargo into these 3 classes was heterogeneous, suggesting that platelet secretion is a stochastic process potentially controlled by several factors, such as cargo solubility, granule shape, and/or granule-plasma membrane fusion routes.
Introduction
Platelets are first responders to vascular damage. The damaged vasculature attracts and activates platelets to release cargo from granular stores: dense, α, and lysosomal. Dense granules contain small molecules (ie, ADP and serotonin).1-3 α-Granules contain polypeptides4 and lysosomes contain hydrolytic enzymes (ie, β-hexosaminidase and cathepsins).2 Release of dense granule cargo is important to hemostasis, given the bleeding diatheses associated with genetic defects in dense granule biogenesis (ie, Hermansky-Pudlak syndrome).5 Released ADP enhances the responsiveness to other agonists generated at the site of vascular damage.6 Release of α-granule cargo has a more heterogeneous impact. Patients who lack α-granules (ie, gray platelet syndrome) generally have more diverse bleeding phenotypes, ranging from severe to mild.7,8 The role that lysosome release plays is unclear; the released hydrolytic enzymes could be important for thrombus remodeling. Although it is clear that platelet secretion is important, it is not clear how the platelet release reaction modulates the microenvironment at vascular injury sites.
Present estimates suggest that activated platelets secrete hundreds of different molecules.9,10 Although dense granules predominantly contain small molecules, α-granules contain a myriad cargo that compose the bulk of the platelet “secretome.” α-Granules contain hemostatic factors (eg, factor V, fibrinogen), angiogenic factors (eg, angiogenin, VEGF), antiangiogenic factors (eg, angiostatin, platelet factor IV [PF4]), growth factors (eg, PDGF, SDF1α), proteases (eg, MMP2, MMP9), necrosis factors (eg, TNF-α, TNF-β), and other cytokines.11 Some are produced by megakaryocytes and packaged into granules during their biosynthesis.12 Patients with gray platelet syndrome presumably have a defect in this process. Other α-granule cargo (eg, fibrinogen and factor V) are not made by megakaryocytes but are thought to be endocytosed by circulating platelets.13 They are then transported to α-granules.12,14
The catalog of cargo suggests that platelet secretion is pivotal to establishing the microenvironment at an injury site. However, very little is understood about how platelet secretion occurs. Studies suggest that certain angiogenesis regulators are packaged into distinct populations of α-granules. Immunofluorescence and immunoelectron microscopy show distinct localizations for proangiongenic and antiangiogenic factors.15 Consistently, other studies have shown that stimulating platelets with different agonists (ie, PAR1- and PAR4-agonists) causes differential release of certain cargo.15-17 This led to the proposal that platelet secretion is contextually thematic: capable of releasing specific sets of cargo (eg, proangiogenic or antiangiogenic factors) in response to specific agonists.18 More recent studies have suggested that cargo is spatially segregated into subregions of the same membrane-bound granules and that there is little colocalization of factors with like functions.19,20 Although intriguing, it is difficult to ascertain how platelets release their myriad cargo in response to the agonists generated at the site of vascular damage. Addressing this question is significant because, if there is heterogeneity in cargo packing and/or secretion, regulating the release of specific α-granule subpopulations may allow specific manipulation of the microenvironment at an injury site without disturbing hemostasis. Our study offers the first systematic examination of the platelet secretion process and its kinetics, and potential heterogeneity.
To define the extent of platelet secretion heterogeneity, we measured the release of serotonin, β-hexosaminidase, and 28 different α-granule cargo proteins. These proteins have a diverse range of biochemical properties, functions, and origins. Four different agonists (PAR1- and 4-agonists, thrombin, and convulxin) were used to stimulate release, and secretion time courses were measured with micro-ELISA arrays. The time course data were fit to a one-phase exponential equation to calculate release rate constants for each cargo molecule detected. These rate constants were analyzed to identify patterns in the release kinetics. In general, the number of α-granule cargo proteins detected in platelet releasates correlated with agonist potency (thrombin > convulxin/PAR1 > PAR4). Although some cargo were more rapidly released than others, no coherent, functional pattern was observed. Detailed analysis of the release rate constants indicated that platelet release heterogeneity is kinetically based and can be defined as 3 classes of events (fast, intermediate, and slow).
Methods
Platelet preparation
Platelets were prepared as described.21 Fresh human platelets from male donors were used and adjusted to 1.2 × 10⁹/mL.
Platelet secretion assay conditions
Secretion from platelets, stimulated with the indicated agonists, was measured 15-300 seconds at room temperature. The agonists were thrombin (Chrono-Log), protease-activated-receptor agonists (SFLLRN for PAR1, Bachem; AYPGKF for PAR4, Invitrogen), and convulxin (Centerchem). An initial titration experiment was performed to determine the minimal dose required to induce ∼ 90% of maximal [3H]-serotonin secretion in 2 minutes. This dose was used for the time-course experiments, which were used to calculate exocytosis rates. The doses were: 0.3 U/mL for thrombin, 50μM for PAR1-agonist, 500μM for PAR4-agonist, and 0.3 μg/mL for convulxin. At the indicated times, platelets and releasates were separated by centrifugation at 13 000g for 2 minutes. The platelet pellets were solubilized with buffer (PBS, pH 7.4, 1% Triton X-100) on ice for 45 minutes. The releasate and the pellet samples were assayed for [3H]-serotonin for dense granules, PF4 for α-granules, and β-hexosaminidase for lysosomes as described.22,23 Subsequent analysis of cargo release was measured by micro-ELISA arrays.
Detection of released cargo using micro-ELISA arrays
Several techniques (ie, mass spectrometry, multiplex bead assay) were considered for this study; however, it was felt that the micro-ELISA was the best method to quantify the individual components in the releasate. Custom micro-ELISA arrays were purchased from RayBiotech. The 28 antibodies, from the vendor's catalog of compatible reagents, were distributed between 2 slides to avoid cross-reactivity (supplemental Table 1, available on the Blood Web site; see the Supplemental Materials link at the top of the online article). Arrays were blocked for 30 minutes, then incubated with 100 μL of standards or diluted platelet releasates at room temperature for 1 hour. The arrays were incubated with biotinylated, detection antibodies and then, with AlexaFluor-555–conjugated streptavidin, each for 1 hour. The slides were rinsed and scanned with an Axon GenePix (Molecular Devices) microarray scanner using λex = 555 nm and λem = 565 nm (10-mm resolution). Each antigen was represented by 4 spots and the average fluorescence intensity was compared with that from a standard curve of like antigen (generated on the same array) to determine the concentrations of a cargo antigen in a given platelet releasate. One array was used to determine the dilution needed to detect all antigens in the linear range of the assay. In general, the arrays' sensitivities were picograms per milliliter to nanograms per milliliter (supplemental Table 2). Array signals were reproducible, differing by < 15% in the 9 arrays used for these studies.
Calculation of a rate constant (Kex)
We cannot directly monitor granule fusion (eg, by membrane capacitance); instead, we infer fusion rates from the rates of appearance of cargo outside the platelet. Analysis was performed using the following reasoning: if a cargo molecule has a fixed probability per unit time (rate), Kex, of being released when its granule fuses with the plasma membrane, then the number of cargo molecules remaining at time t after stimulation is N(t) = N0e−Kext, where N0 is the initial number of molecules. Therefore, cargo concentration outside the platelet is complementary to N(t) and is P(t) = Pmax (1 − e−Kext), [1], where Pmax is the concentration of released cargo at 5 minutes (the maximum time of stimulation) normalized to 100%. Raw data were fit to equation [1] using the curve fit function in IDL (ITT Visual Information Solutions) and confirmed with GraphPad Prism Version 4 software. The curve fit returns the mean squared error (MSE) defined as MSE = ∑i=1N(Pi − P(ti))2/(N − 2), where Pi is the measured percent release at time ti and P(ti) is equation [1] evaluated at ti. The denominator is the number of degrees of freedom where N is the number of time points from which 2 is subtracted because there are 2 parameters in equation [1]. We used Kex values from only those fits where MSE < 150, taking into account the unavoidable inherent sampling error (explanation and for analysis when MSE < 250 was used for data exclusion, see supplemental Methods). Hence, 90 of 174 kinetic measurements were used for further analysis.
Fitting the probability density function
A histogram of all 90 values of Kex, with bin widths of 0.0075, was made. The probability density function (pdf) was obtained from this histogram by dividing the number in each bin by the product of the total number of values (90) and the bin width. The total area under the pdf is 100. To estimate the number of cargo classes, the pdf was fit to either 2 or 3 Gaussian functions.
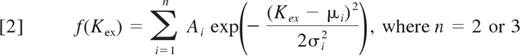
The parameters (Ai, μi, σi) were found using ProFit (Version 6.0.6, www.quansoft.com). We used the F test to assess whether the 3-Gaussian function fit is statistically better than the 2-Gaussian function fit (GraphPad Software).
Modeling operator variance
The Kex values vary over a range from 0.00193 seconds-1 to 0.24 seconds-1 (see Figure 4). As our finest time resolution is 15 seconds, timing errors have larger impact for fast release processes. This results in greater broadening of distribution of the estimated Kex values, even if there were no variation in the intrinsic value of Kex. We exploited this broadening to estimate the number of cargo classes, the mean Kex value for each class, and the operator variance σop2. Factors contributing to the operator variance include timing errors, pipetting variations, etc. We used the following procedure to study the effect of operator variance on our analysis. (1) We chose 2 or 3 Kex values to test whether the data are consistent with 2 or 3 cargo classes. The Kex values were chosen to be the mean values of the individual Gaussian distributions (see Figure 3) when the data were fit with 2 or 3 Gaussians. (2) For each Kex, we computed P(ti) = Pmax (1 − e−Kexti) × (1 − r), where ti is the time when our measurements were made ti ϵ {0,15,30,60,300} and r is a normally distributed random number with a mean of 0 and SD σop. (3) Based on these values of P(ti), we determined Kex using the same procedure described here. (4) Steps 2 and 3 were repeated Nsamples times. (5) The resulting Nsamples of Kex were sorted by size and plotted (see Figure 5). The number of samples (Nsamples) was chosen so that the number of different Kex values (2 or 3) ×Nsamples equaled 90, the number of experimental data points used to construct the pdf (see Figure 3). Steps 2-5 provide just 1 particular sample of possible outcomes. We therefore repeated steps 2-5 a total of 50 times to see the range of possible Kex estimates (see Figure 5 for 90 × 50 Kex values).
Results
Secretion assay conditions and array design
Measuring release of serotonin, PF4, and β-hexosaminidase was done as previously reported.22,23 These markers were used to standardize assay conditions and to determine the concentrations of agonists to be used to stimulate platelet secretion (data not shown). The concentrations required for ∼ 90% of maximal release possible with a given agonist were used for analyses. This assured that stimulation was optimal; thus, the release kinetics reflected platelet exocytosis and not differential activation. Because different extents of platelet activation could account for secretion heterogeneity, we chose this strategy to lessen that variable and focus the analysis on release and not activation. Apyrase was included during platelet isolation to lessen the effects of released ADP. Platelets were not stirred.
To probe the releasates for specific cargo proteins, custom micro-ELISA arrays were produced. This micro-ELISA configuration allows for simultaneous quantification of multiple proteins from the same releasate sample. The antigens to be detected were chosen based on their proposed functions (growth factor, angiogenic factor, cytokine, etc; supplemental Table 1) and on the availability of suitable antibodies. The sensitivity of detection was in the picograms per milliliter to nanograms per milliliter range (supplemental Table 2).
Agonist dependency of cargo release
The release of serotonin, PF4, and β-hexosaminidase is generally considered evidence that secretion from dense granules, α-granules, and lysosomes has occurred, respectively. In agreement with previous studies,24,25 the relative release rates, at the earlier time points, were consistently, serotonin > PF4 > β-hexosaminidase, regardless of the agonist used. Release of serotonin (Figure 1, ■) was most rapid and was generally the most extensive (highest percent release). Release of PF4 (Figure 1, ▴) was more extensive than that of β-hexosaminidase and did approach that of serotonin, especially when PAR-agonists were used. Release of the lysosomal cargo, β-hexosaminidase (Figure 1, ▾), was the least extensive. Interestingly, the extent of β-hexosaminidase release was most sensitive to agonist. Release induced by thrombin and convulxin was 2-fold higher than that induced by either of the PAR-agonists. Serotonin and PF4 release were similarly affected by the agonist used, but not to the same degree.
![Figure 1. Time course of release from activated platelets. Human platelets (1.2 × 10⁹/mL) were prepared as described and were stimulated with thrombin (0.3 U/mL, A), convulxin (0.3 μg/mL, B), PAR1-agonist (50μM, C), or PAR4-agonist (500μM, D) for the indicated times. Thrombin stimulation was stopped with hirudin (0.6 U/mL) followed by centrifugation; the rest of the reactions were stopped by centrifugation, and the releasates were recovered. Release from the 3 classes of granules was measured using the marker cargo molecules: [3H]-serotonin for dense granules (■), PF4 for α-granules (▴), and β-hexosaminidase for lysosomes (▾). Percent release was calculated using the equation [(Releasate)/(Pellet + Releasate)] × 100. Each time point was measured in triplicate, and the averages and SDs are indicated.](/view-large/figure/7316012/zh89991200140001.jpeg)
Time course of release from activated platelets. Human platelets (1.2 × 10⁹/mL) were prepared as described and were stimulated with thrombin (0.3 U/mL, A), convulxin (0.3 μg/mL, B), PAR1-agonist (50μM, C), or PAR4-agonist (500μM, D) for the indicated times. Thrombin stimulation was stopped with hirudin (0.6 U/mL) followed by centrifugation; the rest of the reactions were stopped by centrifugation, and the releasates were recovered. Release from the 3 classes of granules was measured using the marker cargo molecules: [3H]-serotonin for dense granules (■), PF4 for α-granules (▴), and β-hexosaminidase for lysosomes (▾). Percent release was calculated using the equation [(Releasate)/(Pellet + Releasate)] × 100. Each time point was measured in triplicate, and the averages and SDs are indicated.
Time course of release from activated platelets. Human platelets (1.2 × 10⁹/mL) were prepared as described and were stimulated with thrombin (0.3 U/mL, A), convulxin (0.3 μg/mL, B), PAR1-agonist (50μM, C), or PAR4-agonist (500μM, D) for the indicated times. Thrombin stimulation was stopped with hirudin (0.6 U/mL) followed by centrifugation; the rest of the reactions were stopped by centrifugation, and the releasates were recovered. Release from the 3 classes of granules was measured using the marker cargo molecules: [3H]-serotonin for dense granules (■), PF4 for α-granules (▴), and β-hexosaminidase for lysosomes (▾). Percent release was calculated using the equation [(Releasate)/(Pellet + Releasate)] × 100. Each time point was measured in triplicate, and the averages and SDs are indicated.
Agonist potency affected the extent of cargo release. Strong agonists, such as thrombin (Figure 1A) and convulxin (Figure 1B), induced rapid release that was extensive, reaching ∼ 70% of total for serotonin, 50% for PF4, and 30% for β-hexosaminidase. With PAR1-agonist (Figure 1C), release kinetics were similar, but the extents of release were less. PAR4-agonist-stimulated release of the 3 markers was uniformly slower and less extensive (Figure 1D). Perhaps not surprisingly, these results imply that the degree of platelet activation is directly reflected in the speed and/or magnitude of cargo release. Weaker agonists, such as PAR4-agonist, stimulated only partial release, whereas stronger agonists, such as thrombin, stimulated rapid and nearly complete release of intraplatelet stores of cargo. This is most obvious in the release of lysosomal cargo.
Differential release of α-granule cargo
We next sought to qualitatively determine whether there were agonist-dependent differences in α-granule cargo release in response to different agonists. Micro-ELISA arrays and our standard assays were used to monitor the release of 30 different cargo molecules (28 are thought to come from α-granules). Platelets were stimulated with optimized doses of agonists for 5 minutes, and the releasates were probed (Figure 2). Twenty-nine cargo molecules were detected at least once in the releasates from thrombin-stimulated platelets (3 trials), whereas only 17 were detected at least once when PAR4-agonist was used (2 trials). Twenty-seven cargo molecules were detected in releasates from convulxin-stimulated platelets (2 trials), and PAR1-agonist induced the release of 23 different cargo molecules (2 trials). Seven were released on thrombin stimulation that were not released by PAR1-agonist stimulation. Three were released in response to thrombin but not in response to convulxin. No cargo molecule was released only in response to thrombin or only in response to convulxin. When platelets from a single donor were stimulated with the 4 agonists, thrombin (26 released) and PAR1-agonist (23 released) induced the release of more proteins than did convulxin (16 released) or PAR4-agonist (17 released). The discordant response to convulxin by platelets from this single donor is not clearly understood.

Cargo release in response to different agonists. Human platelets (1.2 × 10⁹/mL) were prepared as described and were stimulated with thrombin (0.3 U/mL, T; n = 3), convulxin (0.3 μg/mL, C; n = 2), PAR1-agonist (50μM, P-1; n = 2), or PAR4-agonist (500μM, P-4; n = 2) for 5 minutes. Releasates were then probed using the micro-ELISA arrays, and the presence (gray square) or absence (white square) of a given cargo molecule was recorded. Cumulative data indicate whether a cargo was released at least once in any of the secretion trials performed with the indicated agonist. Single donor indicates the cargo released by platelets from a single donor in response to different agonists. PAR1/PAR4 indicates a direct comparison of the data for cargo release in response to stimulation of either the PAR1 or the PAR4 receptor. Relative abundance indicates the number of molecules of each cargo per resting platelet and was measured using the micro-ELISA arrays.
Cargo release in response to different agonists. Human platelets (1.2 × 10⁹/mL) were prepared as described and were stimulated with thrombin (0.3 U/mL, T; n = 3), convulxin (0.3 μg/mL, C; n = 2), PAR1-agonist (50μM, P-1; n = 2), or PAR4-agonist (500μM, P-4; n = 2) for 5 minutes. Releasates were then probed using the micro-ELISA arrays, and the presence (gray square) or absence (white square) of a given cargo molecule was recorded. Cumulative data indicate whether a cargo was released at least once in any of the secretion trials performed with the indicated agonist. Single donor indicates the cargo released by platelets from a single donor in response to different agonists. PAR1/PAR4 indicates a direct comparison of the data for cargo release in response to stimulation of either the PAR1 or the PAR4 receptor. Relative abundance indicates the number of molecules of each cargo per resting platelet and was measured using the micro-ELISA arrays.
When the compositions of the releasates from PAR1- and PAR4-agonist stimulated platelets were compared, there were clear differences. Eight cargo molecules were specifically released only in response to PAR1-agonist, whereas only 2 specifically appeared in the releasates with PAR4-agonist (Figure 2). There were no obvious functional patterns to these differences. As an example, release of the 3 angiogenic regulators (angiostatin, oncostatin M, and angiogenin) was induced by both agonists. These data show that PAR4-agonist, on average, does not induce release of as many different molecules as does thrombin, convulxin, or PAR1-agonist.
Calculation of release rate constants
The data in the previous section offer a qualitative analysis of platelet secretion at a specific time point, after stimulation. To more fully characterize platelet secretion and to identify potential release patterns, we sought a metric that was less affected by the extent of cargo release and more indicative of the secretion process. Thus, we analyzed the kinetics of platelet exocytosis by measuring the rate constants describing the release of each cargo molecule. Agonist-induced, release time-course measurements were made using micro-ELISA arrays, and the data were fit to the function P(t) = Pmax(1 − e−Kex t). For most α-granule and lysosome cargo, sufficient data were available for good fits to the function with a MSE < 150 (representative fits are shown in supplemental Figure 4). The larger the Kex, the more rapid is the rate of release. Serotonin release was often too rapid for our technique; thus, its rate could not be accurately calculated in all cases. It should be noted that the release kinetics in response to thrombin were of the highest resolution because the reaction was stopped more immediately with hirudin. For other agonists, the reactions were stopped on centrifugation. The continued activation during this workup period decreases the resolution of the measurements.
Analysis of cargo release kinetics
The calculated Kex values were used as descriptors to compare the release kinetics of different cargo molecules, regardless of the extent to which the cargo was released. Four types of analyses were applied to these values. The first was a simple rank ordering (largest Kex to smallest; fastest to slowest) followed by an, albeit artificial, tertile sorting of the data (supplemental Table 3). We sought to determine whether the release rates for a given molecule in response to a specific agonist were in the fastest or slowest third and whether there were patterns in the distribution. When measurements allowed, serotonin release was always in the fastest tertile, regardless of agonist used. PF4 release was in the fastest tertile in response to 3 (thrombin, convulxin, and PAR1-agonist) of the 4 agonists tested. β-hexosaminidase release was in the fastest tertile twice as were ANG, CD62P, and MIP1α release. SDF1α, TGF-β, EGF, MIP1-δ, GRO-α, IL-1α, IL-1β, TNF-β, and TIMP4 were at least found twice in the slowest tertile. PDGF release was in the middle tertile in response to 3 of the 4 agonists (convulxin, PAR1 and PAR4-agonists). Angiostatin and TARC release showed no consistent pattern and ranked in each of 3 tertiles in response to the 4 agonists used. There were no obvious patterns to how molecules were released. Illustrative of this, release of the angiogenic regulators, angiogenin, angiostatin, and oncostatin M was distributed in all 3 tertiles.
We next determined whether the release rates correlated to any biochemical property of the cargo molecules. We plotted Kex versus molecular weight (supplemental Figure 1), relative abundance (supplemental Figure 2), and isoelectric point (as a metric of relative charge; supplemental Figure 3). Linear regression analysis of these data showed no R2 values that reached significance. This indicated that the release rates, as measured by Kex values, did not directly correlate to any of these 3 biochemical properties. Of note, Kex values did not show linear relationship with relative abundance, suggesting that platelet secretion is not simply a function of cargo concentration or abundance.
Probability density function analysis
For the third type of analysis, a probability density function (pdf) was used. This analysis included 90 Kex values shown by the bars in Figure 3. The heavy black curve is the 3-Gaussian function fit and the colored dashed curves represent the individual Gaussian functions (Figure 3). The means of the 3 Gaussians are 0.010, 0.067, and 0.148 seconds-1. These results suggest that the release rates cluster into 3 classes with distinct means. Serotonin, when accurate measurements were made, was always in the fastest class (Figure 4). TNF-β was in the slowest class in response to 3 of the 4 agonists. Release of TNF-α, IL-1β, or EGF (when detectible) was always in the slowest class. TNF-β, angiostatin, PF4, and β-hexosaminidase release showed no consistent pattern and ranked in each of the 3 classes in response to the 4 agonists used. TNF-β release was in the fastest class once and the slowest class 3 times. As with the ranked-tertile analysis, no obvious functional patterns were detected. Release of the angiogenic regulators, angiostatin, VEGF, and oncostatin M were either in the middle or in slowest class, whereas release of angiogenin occurred in all 3 classes. From this analysis, we conclude that there are 3 kinetically distinct classes of cargo release. A 2-Gaussian fit did not adequately describe the pdf on the basis of the F test (P = 1.5 × 10⁻⁵).

Probability density function (pdf) of the frequency distribution of Kex values. Human platelets (1.2 × 10⁹ /mL) were prepared as described and were stimulated with thrombin (0.3 U/mL; n = 3), convulxin (0.3 μg/mL; n = 2), PAR1-agonist (50μM; n = 2), or PAR4-agonist (500μM; n = 2) for increasing times. Releasates were probed using the micro-ELISA arrays, and the rate constant, Kex of release was calculated for each cargo molecule. The pool of Kex values with MSE < 150 was used for constructing the pdf. The best-fit curve is seen in black corresponding to the existence of 3 different subclasses. The dashed blue, green and red curves are the Gaussian functions that represent fast, intermediate, and slow classes, respectively.
Probability density function (pdf) of the frequency distribution of Kex values. Human platelets (1.2 × 10⁹ /mL) were prepared as described and were stimulated with thrombin (0.3 U/mL; n = 3), convulxin (0.3 μg/mL; n = 2), PAR1-agonist (50μM; n = 2), or PAR4-agonist (500μM; n = 2) for increasing times. Releasates were probed using the micro-ELISA arrays, and the rate constant, Kex of release was calculated for each cargo molecule. The pool of Kex values with MSE < 150 was used for constructing the pdf. The best-fit curve is seen in black corresponding to the existence of 3 different subclasses. The dashed blue, green and red curves are the Gaussian functions that represent fast, intermediate, and slow classes, respectively.

Distribution of Kex values. The rate constants, Kex, were calculated as described, and the average was obtained for each from multiple trials involving various agonists for stimulating the platelets. The values are divided into 3 different classes represented by different colors based on their distribution in pdf in Figure 3. The cargo in gray, white, and dark gray correspond to the fast, intermediate, and slow classes, respectively.
Distribution of Kex values. The rate constants, Kex, were calculated as described, and the average was obtained for each from multiple trials involving various agonists for stimulating the platelets. The values are divided into 3 different classes represented by different colors based on their distribution in pdf in Figure 3. The cargo in gray, white, and dark gray correspond to the fast, intermediate, and slow classes, respectively.
Operator variance analysis
To confirm our conclusions, we examined how operator variance would affect the values of Kex using the procedure described in “Modeling operator variance.” The questions posed were: (1) how many cargo classes are there and (2) what are the mean Kex values for each class? Figure 5 shows the distribution of the calculated Kex values (open symbols) assuming 3 cargo classes with Kex values equaling the mean values obtained from the 3-Gaussian distributions in Figure 3. The Kex values used were 0.010, 0.067, and 0.148 seconds-1. The solid symbols are from the 90 Kex values obtained from our experiments. The Index is simply the ordinal number of the Kex value. There is overlap of the experimental and simulated Kex values in the low and high index ranges but not in the middle range. To obtain a better overlap, we adjusted the middle rate constant to 0.033 seconds-1. Panel B shows that this adjustment produces a much better overlap. Assuming 2 cargo classes with Kex = 0.010 seconds-1 and 0.148 seconds-1 results in the distribution shown in panel C. The “breaks” in the simulated and actual Kex distributions occur at different places. Changes in Kex did not improve the overlap. This result supports the F test result (noted in the previous section) indicating that the 3-Gaussian fit is statistically superior to the 2-Gaussian fit.

Cargo characteristics from modeling operator variance. The distribution of the simulated Kex values (open symbols) assuming 3 (A,B,D) or 2 (C) cargo classes with Kex values equaling the mean values obtained from the 3-Gaussian fit shown in Figure 3. The closed symbols represent the 90 Kex values obtained from our experimental measurements. The Index is simply the ordinal number of the Kex value. The rate constants and the operator variances used for the analysis are varied in different panels to get a better overlap with the obtained experimental Kex values. The description of the variable in each panel is as follows: (A) Three cargo classes, Kex = 0.010, 0.067, and 0.148; σop = 0.2. (B) Three cargo classes, Kex = 0.010, 0.033, and 0.148; σop = 0.2. (C) Two cargo classes, Kex = 0.010 and 0.148; σop = 0.2. (D) Three cargo classes, Kex = 0.010, 0.033, and 0.148; σop = 0.1.
Cargo characteristics from modeling operator variance. The distribution of the simulated Kex values (open symbols) assuming 3 (A,B,D) or 2 (C) cargo classes with Kex values equaling the mean values obtained from the 3-Gaussian fit shown in Figure 3. The closed symbols represent the 90 Kex values obtained from our experimental measurements. The Index is simply the ordinal number of the Kex value. The rate constants and the operator variances used for the analysis are varied in different panels to get a better overlap with the obtained experimental Kex values. The description of the variable in each panel is as follows: (A) Three cargo classes, Kex = 0.010, 0.067, and 0.148; σop = 0.2. (B) Three cargo classes, Kex = 0.010, 0.033, and 0.148; σop = 0.2. (C) Two cargo classes, Kex = 0.010 and 0.148; σop = 0.2. (D) Three cargo classes, Kex = 0.010, 0.033, and 0.148; σop = 0.1.
The distributions in panels A, B, and C were generated using σop = 0.2. To estimate the operator variance, we changed σop between 0 and 0.3. Panel D shows the result when σop = 0.1 and Kex = 0.010, 0.033, and 0.148 seconds-1. The overlap is poorer compared with panel B; and, notably, the breaks in the distributions occur at different indices. σop = 0 produces 3 discontinuous horizontal distributions at Kex = 0.010, 0.033, and 0.148 seconds-1. When σop = 0.3, the data were so poor that we could not fit the data to equation [1]. Therefore, the operator variance is between 0.1 and 0.3 and most likely 0.2.
Cargo molecules do not consistently associate with 1 class
To determine whether a cargo molecule was consistently released via 1 kinetic class, we examined the Kex values of 9 cargo molecules that were detected in ≥ 4 experiments. The Kex values are given in Table 1. The last row is the ratio r of the largest to smallest Kex value for that cargo molecule. If a cargo molecule is always present in 1 kinetic class, then r would be ∼ 1. However, r ranges from ∼ 3-80. TNF-α has the smallest r value of 3.3 with the smallest Kex equaling 0.0210 and the largest 0.0691 seconds-1. The larger Kex is probably part of the fast kinetic class whose mean value is 0.148 seconds-1, whereas the smaller 3 Kex values are probably part of the medium class whose mean is 0.033 seconds-1. Angiogenin, PDGF, and serotonin appear in the fast and medium classes, whereas angiostatin, SDF1α, TNF-β, and PF4 appear in all 3 classes.
Representation of cargo packaging by kinetics of release
| Cargo | Angiogenin | Angiostatin | PDGF | SDF1-α | TARC | TNF-α | TNF-β | Serotonin | PF4 |
|---|---|---|---|---|---|---|---|---|---|
| Kex values | 0.0247 | 0.0024 | 0.0214 | 0.0027 | 0.0103 | 0.0210 | 0.0019 | 0.0264 | 0.0083 |
| 0.0266 | 0.0125 | 0.0306 | 0.0292 | 0.0205 | 0.0288 | 0.0176 | 0.0672 | 0.0086 | |
| 0.0349 | 0.0288 | 0.0480 | 0.0340 | 0.0262 | 0.0263 | 0.0207 | 0.0934 | 0.0390 | |
| 0.0466 | 0.0365 | 0.0728 | 0.0370 | 0.1091 | 0.0691 | 0.0239 | 0.1657 | 0.0645 | |
| 0.0674 | 0.0635 | 0.0747 | 0.1644 | — | — | 0.1535 | 0.2176 | 0.0732 | |
| 0.1321 | — | 0.1398 | — | — | — | — | — | 0.1299 | |
| 0.1326 | — | — | — | — | — | — | — | 0.1529 | |
| r | 5.37 | 26.86 | 6.52 | 62.00 | 10.57 | 3.29 | 79.73 | 8.23 | 18.32 |
Listed are the Kex values of 9 different cargo molecules found in ≥ 4 releasate trials. The last row represents the ratio, r, of the largest to the smallest Kex of the corresponding cargo.
— indicates not avaliable.
Agonists do not activate only 1 cargo class
If an agonist were to activate only a single cargo class, then the Kex values measured with that agonist would cluster about a single value. To test this hypothesis, we generated pdfs of Kex values obtained in experiments where the platelets were stimulated with thrombin, PAR1-agonist, or convulxin. We did not use the PAR4-agonist data because the number of acceptable Kex values (n = 11) was too small for a sensible pdf. We had 43 Kex values for thrombin, 19 for PAR1, and 17 for convulxin. Figure 6 shows the pdfs for the 3 agonists. The 3 Gaussian functions used to generate the best-fit distribution in Figure 3 are superimposed on the pdfs. The individual pdfs follow approximately the 3 Gaussian functions suggesting that the 3 agonists activate all 3 cargo classes.

Frequency distribution of Kex resulting from activation by different agonists. The rate constants, Kex, were calculated as in “Methods.” The gray bars represent the frequency distribution of Kex values obtained on stimulation of platelets with various agonists as indicated. Superimposed dashed curves represent the Gaussian functions shown in Figure 3. The number of Kex values used in making the pdfs incorporate 43 Kex values for thrombin (A), 19 Kex values for PAR1-agonist (B), and 17 Kex values for convulxin (C).
Frequency distribution of Kex resulting from activation by different agonists. The rate constants, Kex, were calculated as in “Methods.” The gray bars represent the frequency distribution of Kex values obtained on stimulation of platelets with various agonists as indicated. Superimposed dashed curves represent the Gaussian functions shown in Figure 3. The number of Kex values used in making the pdfs incorporate 43 Kex values for thrombin (A), 19 Kex values for PAR1-agonist (B), and 17 Kex values for convulxin (C).
Discussion
In this manuscript, we present the first systematic analysis of human platelet secretion in which the release kinetics of multiple cargo molecules is examined. We simultaneously measured the time-dependent release of 30 distinct molecules from platelets stimulated separately with 4 different agonists. Agonist concentrations were chosen to maximize release and to minimize the ambiguities of partial platelet activation. Our qualitative analysis (Figure 2; supplemental Table 3) shows that the extent and rate of release are related to agonist potency: thrombin induced the most rapid release of the highest number of cargo molecules and the PAR4-agonist induced the slowest, least extensive release. There were no overt functional patterns in what was released when comparing the responses to the 4 agonists tested. Release speed (as represented by Kex) did correlate with agonist potency (and agonist dose; data not shown) but not with molecular weight, charge, or abundance of the cargo (supplemental Figures 1-3). Our quantitative analyses of the distribution of Kex values indicated that platelet secretion could be minimally described as the summation of 3 kinetically distinct classes of release events (Figure 3). Distribution of cargo into these kinetic classes did not correlate with overt functional patterns. A recent report19 suggests that α-granule cargo are stochastically packaged into subdomains within single granules, not segregated into specific granule subclasses. If packaging is random, then one might expect that platelet cargo release is a stochastic process controlled by other factors, such as granule-plasma membrane fusion rates. Our data are consistent with that expectation.
Platelets have the potential to control the vascular microenvironment through the myriad molecules they secrete on activation.26 The work of Italiano et al15 and others16,17 suggested that proangiogenic and antiangiogenic factors could be differentially released in response to specific agonists. In general, these studies measured secretion at single time points (or agonist concentrations), making them difficult to compare with the kinetic measurements presented here. It is possible that the observed release heterogeneity could be a function of partial platelet activation. Based on a detailed examination of our secretion time-courses and agonist titrations, one could devise specific conditions that could result in what appears to be thematically differential release of platelet cargo. These conditions represent specific stages in the activation process and may not reflect the continuum of events occurring in a growing thrombus. Our choice of reaction conditions limited this variable and focused our analysis on the secretion process. At the site of vascular damage, the extent of platelet activation may be stratified; thus, granule release may vary both spatially and temporally. Future studies of in situ platelet secretion are needed to fully understand platelet exocytosis; however, our data suggest that focus should be placed on the kinetics of the process.
Our analyses suggest that platelet release is best described as the summation of at least 3 classes of release processes differing in rate, but the distribution of cargo into each class is random. To conceptualize this, we use a postal system analogy. The mailmen are the platelets delivering the granule cargo (the mail). There are 3 mail classes: express, first class and bulk; each arrives at different rates. Serotonin, in dense granules, was the only true express cargo; other α-granule cargo were distributed into all 3 classes. This implies that, aside from serotonin, the mail sorters are blinded to content; thus, inclusion into each of the 3 mail classes is random. Random sorting of α-granule cargo is consistent with the lack of thematic colocalization of cargo reported.19,20 The distinction between dense (ie, serotonin) and α-granule cargo is also consistent with the fact that 2 distinct sorting machinery are required to make the 2 classes of granules.27 How kinetic heterogeneity in α-granule cargo release is generated remains to be determined.
Simplistically, regulated exocytosis is the stimulation-dependent fusion of spherical, cargo-containing granules with the plasma membrane. A variation on this, compound fusion, occurs when granules fuse with each other prior or subsequent to fusion with the plasma membrane. The granules can be homogeneous (eg, synaptic vesicles in neurons) or heterogeneous (eg, azurophilic, peroxidase negative, etc; granules in neutrophils). In homogeneous systems, release occurs with 2 general kinetic components: burst and sustained. The rapid, burst phase represents vesicles that are docked with their secretory machinery primed for fusion (as perhaps seen for dense granules). The sustained phase represents release from vesicles that must be recruited to fusion sites. In heterogeneous systems, the different granule populations are thought to have distinct properties. At a first approximation, platelets are examples of the latter class. Dense granule release is more rapid than α-granule or lysosome release; a trend that held for all agonists tested here (Figures 1 and 4). Because release from all 3 granules requires the same SNAREs (VAMP-8,21 SNAP-23,22,28-30 and syntaxin 1131 ) and at least 2 of the same SNARE regulators (Munc18b32 and Munc13-433 ), it is unclear how secretory machinery usage explains the observed differences. However, loss of VAMP-8 has a greater effect on PF4 release.21 Deletion of Munc13-4 has a greater effect on serotonin release.33 Loss of syntaxin 1131 or Munc1832 affected serotonin and PF4 release more than β-hexosaminidase release. Thus, differential use or regulation of the same secretory machinery could account for differences between the 3 granule populations. Alternatively, the underlying kinetic patterns might reflect the types of membrane fusion. Platelet granules (specifically α-granules) do undergo compound fusion during the exocytosis process.34 The rates of these 2 types of membrane fusion (primary and compound) could partially account for the differential release kinetics reported here. Another possibility may relate to the distribution of cargo proteins. Cargo is heterogeneously distributed inside a granule35 and differential solubilization of these “cargo clusters,” once granule and plasma membranes fuse, could underlie release heterogeneity. These explanations (as are our mathematical analyses) are based on the concept that platelet granules are spherical, like synaptic vesicles. Recent ultrastructural analysis35 indicates that α-granules may, indeed, be tubular and thus their fusion could be polarized. Fusion at one end of a tube might cause differential release rates as the tube empties, depending on where in the tube the cargo resides. At this stage, it is impossible to be more than speculative about the mechanism(s) until more “real-time” in situ measurements of platelet cargo release are obtained. What these data show is that there is much more to learn about how platelets release their cargo.
The online version of this article contains a data supplement.
The publication costs of this article were defrayed in part by page charge payment. Therefore, and solely to indicate this fact, this article is hereby marked “advertisement” in accordance with 18 USC section 1734.
Acknowledgments
The authors thank members of the S.W.W. laboratory for their careful reading of this manuscript and helpful comments, as well as the staff at RayBiotech for their help in micro-ELISA array design.
This work was supported by the National Institutes of Health (grants HL56652 and HL082193; S.W.W.) and the University of Kentucky (University Research Professorship Award; S.W.W.).
National Institutes of Health
Authorship
Contribution: D.J. and S.W.W. designed and performed the experiments, analyzed data, and wrote the manuscript; and L.T.I. performed the mathematical modeling and wrote the mathematical analysis section of the manuscript.
Conflict-of-interest disclosure: The authors declare no competing financial interests.
Correspondence: Sidney W. Whiteheart, Department of Molecular and Cellular Biochemistry, University of Kentucky College of Medicine, Lexington, KY 40536; e-mail: whitehe@uky.edu.

This feature is available to Subscribers Only
Sign In or Create an Account Close Modal