Abstract
Abstract 5177
Renal dysfunction has been reported in adult subjects with thalassemia major (TM) since 1975. One of the main cause is the iron overload consequent to regular transfusions. Multiecho T2* MRI is a well-established technique for cardiac and hepatic iron overload assessment, but there very few report concerning the kidneys.
The aims of this study were to describe the T2* values of the kidneys in patients with TM, to investigate the correlation between renal and myocardial or hepatic siderosis and biventricular cardiac function.
119 TM patients (58 men, 30. 7 ± 8. 2 years) enrolled in the Myocardial Iron Overload (MIOT) networks underwent MRI. For the measurement of iron overload, multiecho T2* sequences were used. The left ventricle was segmented into a 16-segments standardized model and the T2* value on each segment was calculated as well as the global value. In the liver, the T2* value was assessed in a single region of interest (ROI) in a homogeneous area of the parenchyma. For each kidney, T2* values were calculated in three different ROIs and were averaged to obtain a representative value for the kidney. The mean T2* value over the kidneys was also calculated. Cine images were obtained to quantify biventricular morphological and functional parameters in a standard way.
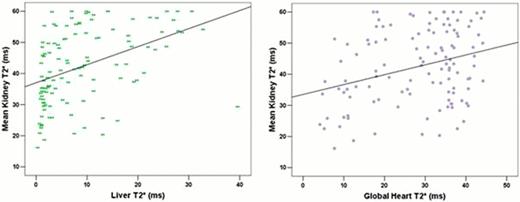
T2* values in the right kidney were significant lower than in the left kidney (40. 3±11. 9 ms vs 44. 1±12. 7 ms, P<0. 0001). The mean T2* value over the kidneys was 42. 2±11. 9 ms and 40 patients (33. 6%) had a pathological value (T2*<36 ms, lower limit of normal evaluated on 20 healthy subjects). The mean T2* value did not show a significant difference amongst men ad women (43. 2±11. 7 ms versus 41. 3±12. 1 ms, P=0. 378). The mean T2* values increased with age in a significant manner (r=0. 321, P<0. 0001). There was a significant negative correlation between serum ferritin levels and mean renal T2* values (r=-0. 446, P<0. 0001). Significant positive correlations of the mean T2* values were demonstrated for liver (r=0. 511, P<0. 0001) and global heart (r=0. 262, P=0. 004) T2* values (Figure 1). No correlation was found between renal iron overload and bi-ventricular function parameters.
Systemic T2* differences between left and right kidneys were found, with significant lower values in the right one. Mean T2* value increased with age. We confirmed that kidney iron deposition was not very common in TM, but it was correlated with iron deposition in liver and heart.
Scatter diagram and regression line of mean renal T2* values versus liver T2* values (left) and versus global heart T2*values (right).
Scatter diagram and regression line of mean renal T2* values versus liver T2* values (left) and versus global heart T2*values (right).
No relevant conflicts of interest to declare.
Author notes
Asterisk with author names denotes non-ASH members.


This feature is available to Subscribers Only
Sign In or Create an Account Close Modal