Abstract
Abstract 4954
Patients with myelodysplastic syndromes (MDS) and acute myeloid leukaemia (AML) with multilineage dysplasia are known to display several immunological abnormalities. Azacitidine represents a therapeutic options for these disorders and, beside the well known effects on bone marrow precursors, has been demonstrated to potentially influence T-cell polarization. The aim of this study is to monitor the kinetic of the T-cell receptor (TCR) repertoire during Azacitidine treatment in order to explore its potential ability, not only to restore the hematopoietic function, but also to reverse the immune derangement typical of these patients.
Our study consists in a flow cytometric and spectratyping analysis performed on the peripheral blood of 9 patients (4 with MDS and 5 with AML with multilineage dysplasia) and 30 normal controls. Each patient is evaluated at baseline and then every 3 cycles of Azacitidine. The flow cytometry analysis is based on a panel of 24 beta variable (BV) family-specific antibodies. A BV expansion is defined as any value of BV family expression higher than the mean + 3 standard deviations calculated in controls. We then analysed the profile of the third complementarity-determining-region (CDR3) in separated helper and cytotoxic T-cells by spectratyping. After immunomagnetic CD4+/CD8+ cell separation, RNA extraction and reverse transcriptase PCR, CDR3 fragment analysis was performed through capillary electrophoresis. Spectratyping evaluation was carried out by determining the percentage of Gaussian, missing, skewed and oligoclonal beta-variable (BV) subfamilies.
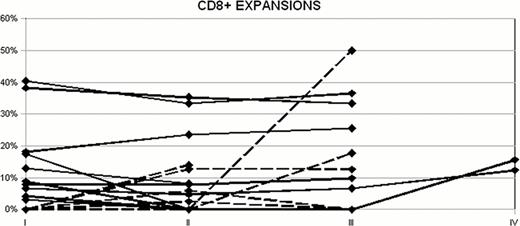
Our patients had a median of 3 assessments during their treatment with Azacitidine. At baseline, in CD4+ cells 5 patients did not show any lymphocyte expansion while 4 of them showed a single BV expansion. One of these expansions disappeared after 3 cycles while 3 were stable during treatment. When reassessed during therapy, 2 of the patients showed each the appearance of 3 new BV expansions, some of which however disappeared at the following evaluations. Overall CD4+ expansions during the all period of study were 10 (4 at baseline and 6 emerged during treatment) and their size ranged from 7. 1% in BV 13. 6 to 23. 9% in BV 11. Within the CD8+ subset, at baseline 6 out of 9 patients showed at least one T-cell expansion. In details 2 patients showed a single expansion while 4 of them displayed 2 different BV expansions. Of these 10 baseline expansions 6 were stable during treatment, while 4 of them quickly disappeared. Noteworthy, one of these expansions which had disappeared in a patient in remission reappeared at disease relapse. Six patients showed the appearance of a single BV expansion during treatment, which once again was usually transient. Overall CD8+ expansions during the all period of evaluation were 16 (10 at baseline and 6 emerged later) and their size ranged from 2. 5% in BV 5. 3 to 50. 1% in BV 3. Preliminary data on the spectratyping analysis showed a gradual improvement in the TCR repertoire diversity, due to the progressive reduction in the frequency of non Gaussian CDR3 profiles, especially remarkable as regards the number of missing BVs.
Our findings firstly confirmed in our patients an overall derangement of the TCR repertoire. However this pattern seems to gradually improve during Azacitidine treatment, as witnessed by the disappearance of some BV expansions observed on flow cytometry -particularly within the CD8+ subset-, as well as by the progressive restoration of the CDR3 diversity detected by spectratyping. These preliminary data seem to suggest that Azacitidine could be potentially able, not only to restore the hematopoietic function, but also to reverse the immune derangement typical of patients with MDS and AML with multilineage dysplasia.
shows the kinetic of expanded T-cell subpopulations in MDS patients during Azacitidine treatment at different time points (every 3 months). Expansions already present at baseline or emerged during therapy are represented as continuous or dashed lines respectively. By convention values below the mean + 3 standard deviations are represented with a value of 0. 0 %.
shows the kinetic of expanded T-cell subpopulations in MDS patients during Azacitidine treatment at different time points (every 3 months). Expansions already present at baseline or emerged during therapy are represented as continuous or dashed lines respectively. By convention values below the mean + 3 standard deviations are represented with a value of 0. 0 %.
No relevant conflicts of interest to declare.
Author notes
Asterisk with author names denotes non-ASH members.


This feature is available to Subscribers Only
Sign In or Create an Account Close Modal